Inicio
La primera página de la consola, en tres pestañas. Overview lee cuánto está entrando, qué se movió y qué necesita a una persona, cada número los últimos catorce días contra los catorce anteriores. Reviews guarda los cambios de flags que esperan un segundo par de ojos. Needs you reúne las ejecuciones de flujo fallidas y en espera junto a los flags que piden atención, una tarjeta cada una, y la entrada Home de la barra lateral cuenta lo que esas dos pestañas retienen.
Three tabs
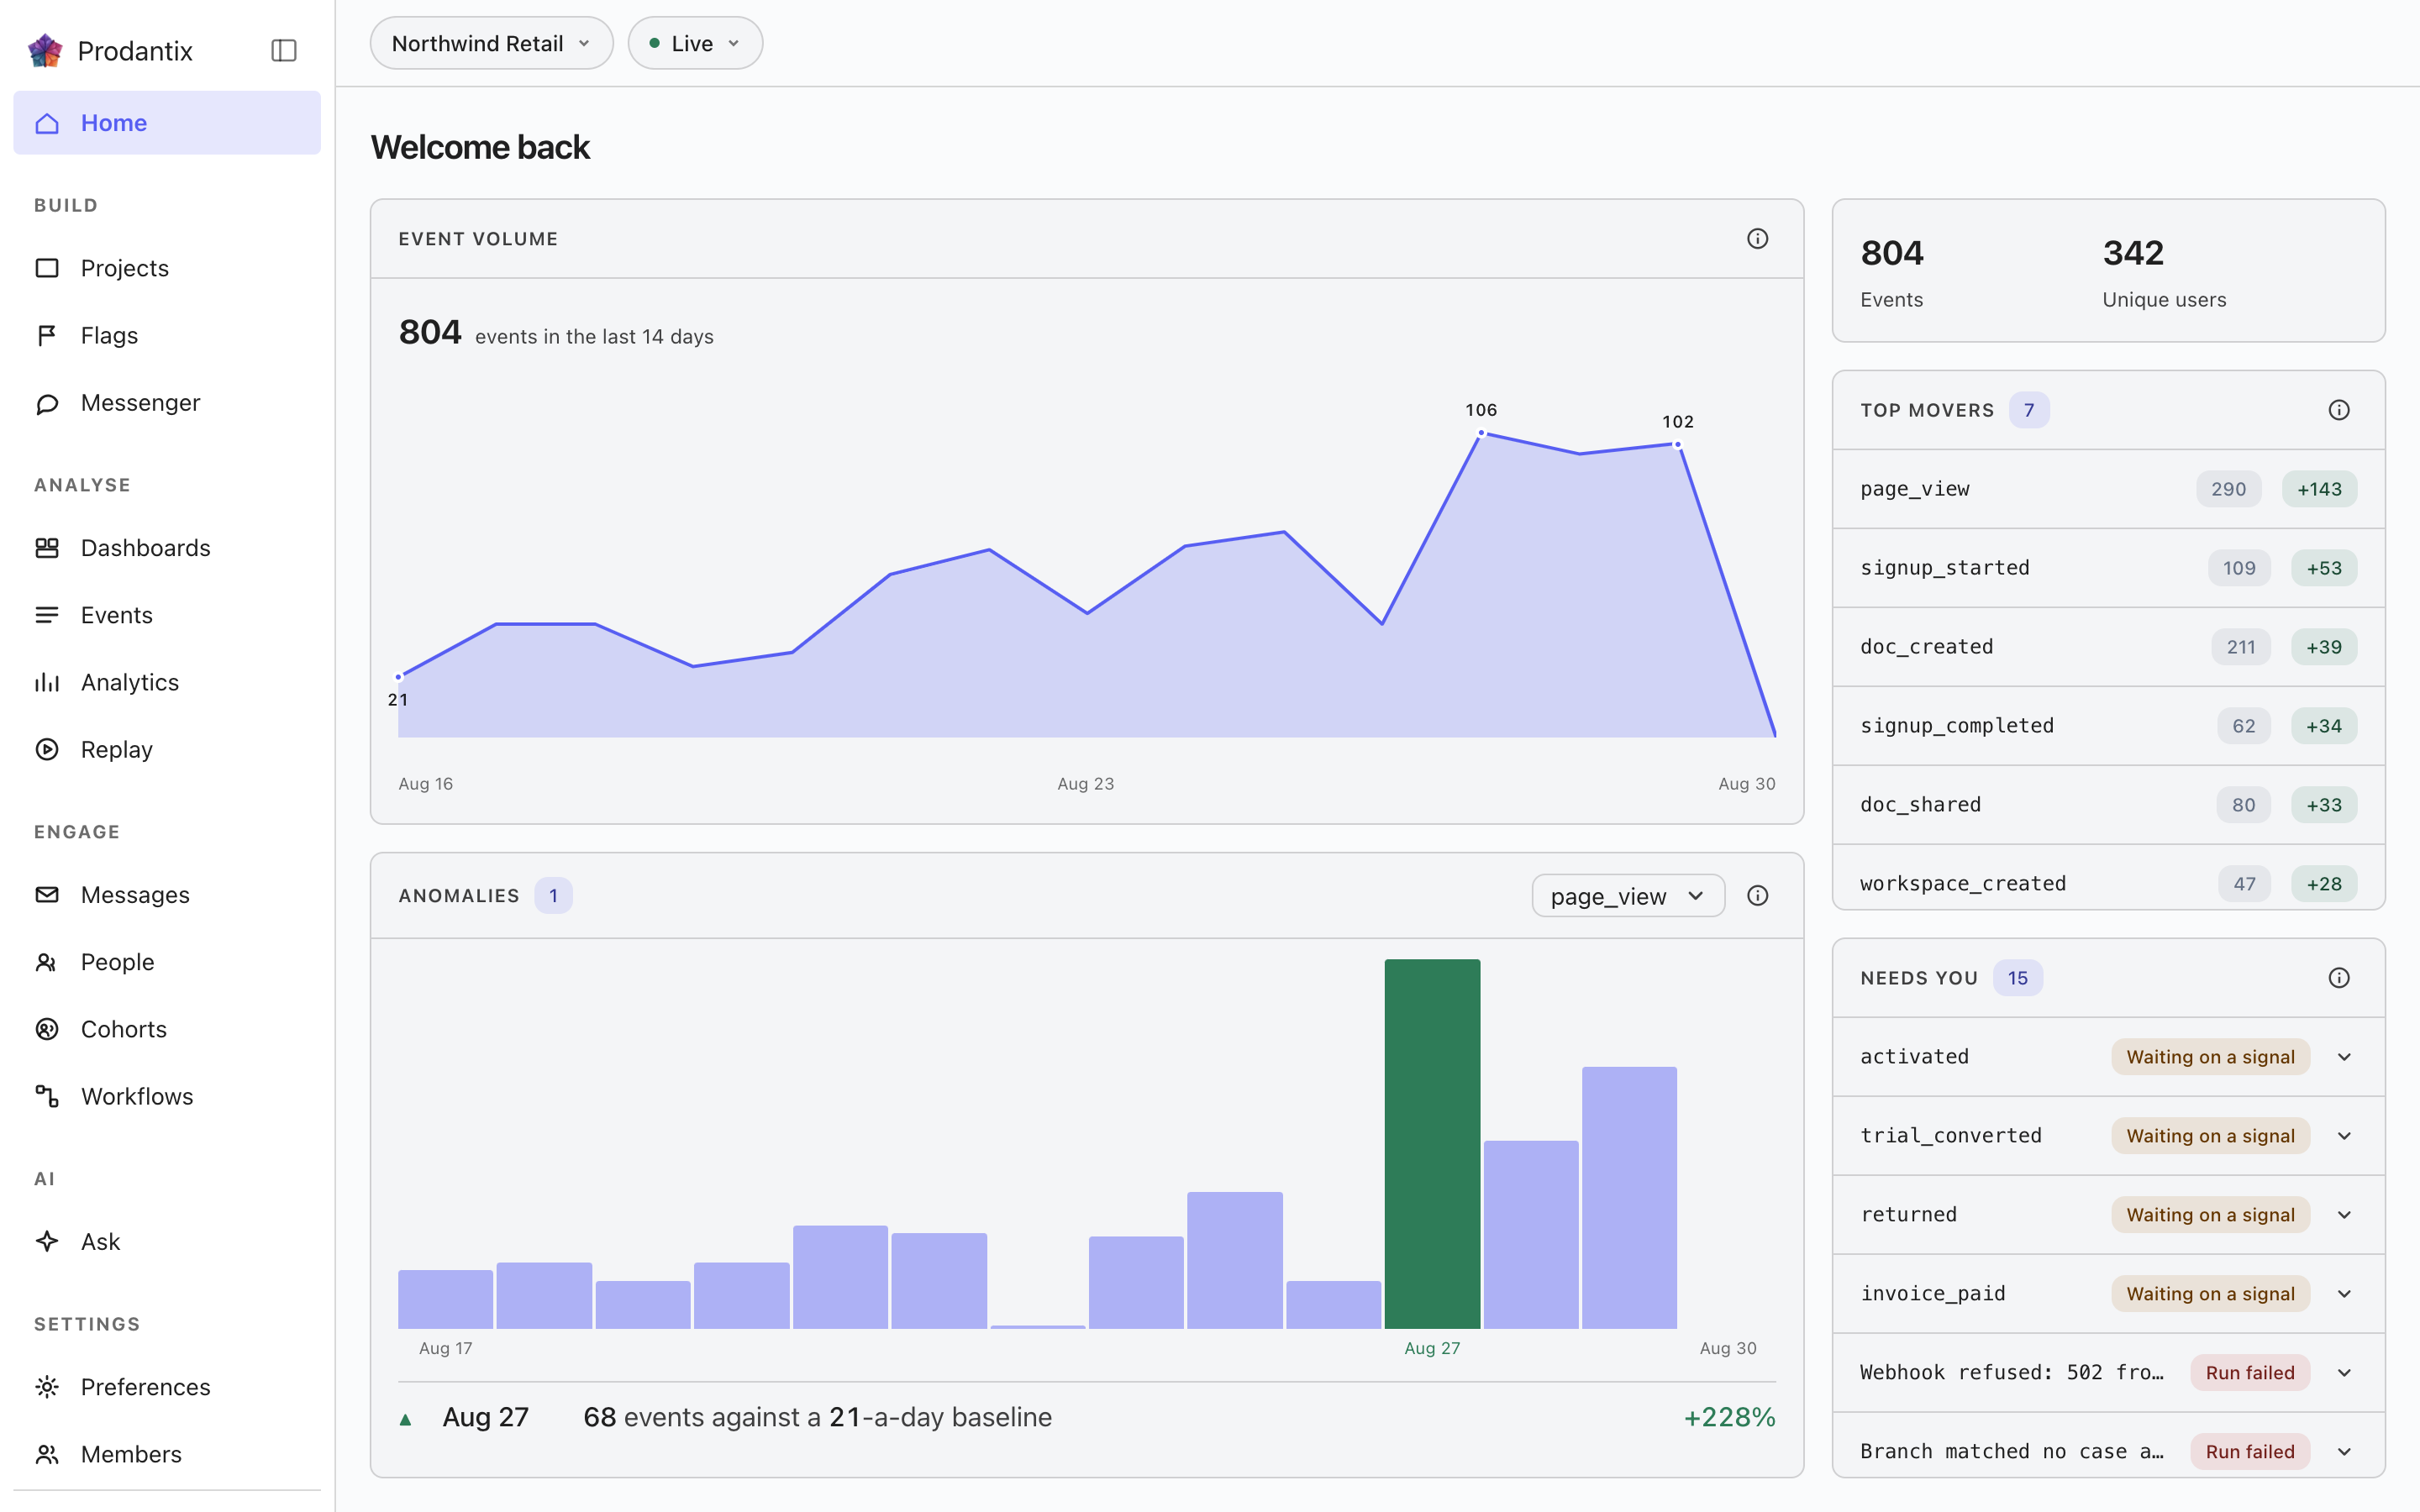
Overview es la primera página de hoy: la banda de métricas, Top movers, Event volume y Anomalies. Reviews es la bandeja de revisión que antes era una página propia: las solicitudes de cambio de flags del proyecto, filtradas por estado y con búsqueda, cada una abriendo su solicitud junto a la cuadrícula, y la dirección antigua, /reviews, reenvía aquí. Needs you lista todo lo que una persona tiene que atender, una tarjeta por elemento. La fila de pestañas lleva un contador en Reviews y en Needs you, y la entrada Home de la barra lateral lleva su suma, así que el raíl dice cuánto espera antes de abrir la página. La dirección lleva la pestaña como ?tab=, así que un enlace aterriza en la pestaña que nombra.
The metrics band
Two totals for the last fourteen days: events received and the people they came from. A project with nothing in the window shows an explanation rather than zeros, and a failed load says it failed rather than reading as a quiet account.
Needs you
Todo lo que una persona tiene que atender, una tarjeta cada uno: ejecuciones de flujo que fallaron, ejecuciones que esperan una señal, flags que nada ha evaluado últimamente y flags que superaron la vida útil que su intención declara. Una ejecución fallida lleva el tono de error; las otras tres son llamadas al lector, no fallos. Cada tarjeta nombra su tipo en un chip, sus datos en una línea, y lleva su propia salida: abrir la ejecución o el flag que nombra, lanzar el flujo de nuevo, enviar la señal que espera una ejecución en pausa, o archivar un flag terminado. El contador de la pestaña es la lista entera, así que una lista que se desplaza sigue diciendo cuánto retiene. Un insight vigilado cuyo límite está superado es un quinto tipo, Umbral: la tarjeta nombra el insight, el límite y el valor que leyó la comprobación diaria, y abre el insight con la banda que superó.
Top movers
The events whose counts moved most against the preceding window of equal length: the last fourteen days against the fourteen before them. Each row shows the current count and a signed delta, so a spike and a collapse are equally visible.
Event volume
Ingest volume across the window as a chart, with empty days drawn as empty rather than skipped: a project that went quiet for a week looks quiet, not compressed.
Anomalies
One event at a time, chosen in the panel's picker and opening on the project's busiest: a bar per day across the fourteen-day window, so the baseline is visible rather than asserted. A day whose count left that baseline is tinted and dated, and a row beneath marks it ▲ or ▼ and names the count against the baseline it left. A fortnight that held its line still draws the band and says so.
The account menu


Your avatar at the foot of the sidebar opens the account menu. Under your name and email, the first group is your companies: every prodantix company this sign-in belongs to, the name over your role in it (Owner, Admin, Billing or Member), with a check on the one the console is scoped to. Choose another and the row shows a spinner while the console asks your sign-in to scope to that company, then reloads: the re-drawn console is the confirmation, and there is no toast. A switch that failed says so under the row, with Retry. When your sign-in is too old to switch with, the row reads Your sign-in is out of date and offers Sign in again, which signs you in afresh and brings you back to the page you were on. One company held still draws its row with the check, so you can see which company scopes everything the menu names below it. The group offers no create and no manage row: you join an existing company by invitation (User management), never from here. On the wire the group is myCompanies (GraphQL reference); a switch is a session call that carries your own sign-in, so it is not part of the GraphQL API.
A sign-in whose token names no prodantix company, which happens when the Bomdisoft ID joined another product's company first, does not land in an empty console. The page body is replaced by one card, Choose a company, with the sidebar staying in place around it. The card lists the same rows as the menu with every gutter empty, since nothing is active yet, and nothing is chosen on your behalf: a member of one company still sees one row and picks it. Choosing scopes the sign-in to that company and reloads the console. A card whose list could not be read draws Retry where the rows would be.
A sign-in that belongs to no prodantix company at all meets Set up your company in the same place, with the sidebar faded around it and a note in the sidebar saying that projects, analytics and messages live in a company. When you own an organisation in another Bomdisoft product, a switch offers Use one you own, which turns the organisation you pick into your prodantix company, or Create a new one. Using one brings only you in: nobody else in that organisation joins prodantix. With nothing to use, the card asks for a Company name straight away. Either way you name the company's first project under First project name and press Create once; the console shows that project's keys, and Continue opens Home in the new company. When your organisations could not be checked, the switch stays with Use one you own unavailable and Create a new one selected, over the line Could not check for organisations you already own. and a Try again. A company that was made but is not ready yet says so and finishes on the next Create, and an organisation that already has a prodantix company asks you to get an invitation from its owner. Joining somebody else's company is still by invitation, and the card says so under Create.
Below the divider, the accounts group: the prodantix accounts this sign-in holds, each by its name, or numbered and marked unnamed when it has none, with the current one checked. Picking another switches the same way, a spinner on the row and the console reloading on that account, with the reason inline and Retry if it failed. A suspended account carries a Suspended chip and cannot be opened.
The rows after the groups leave the console: Manage account opens your Bomdisoft account in a new tab, where profile, security and devices live for every Bomdisoft product; Billing opens the shared billing site the same way; Sign out ends the session.
Where this meets the API
The concept behind the numbers is the Analytics pillar. On the wire, every panel is a read: the metrics band, movers and volume are runQuery aggregations, the anomalies strip pairs runQuery with aiInsights (a z-score over the same daily counts, no model call), Needs you joins flags with workflow runs, and the Reviews tab reads flagChangeRequests, answered through approveFlagChange and rejectFlagChange, or taken back by the requester through withdrawFlagChange (GraphQL reference). The events being counted arrive through the ingest edge (Ingestion), and Needs you stays current between reloads by listening to flag and workflow run changes (Realtime events).