Analyses
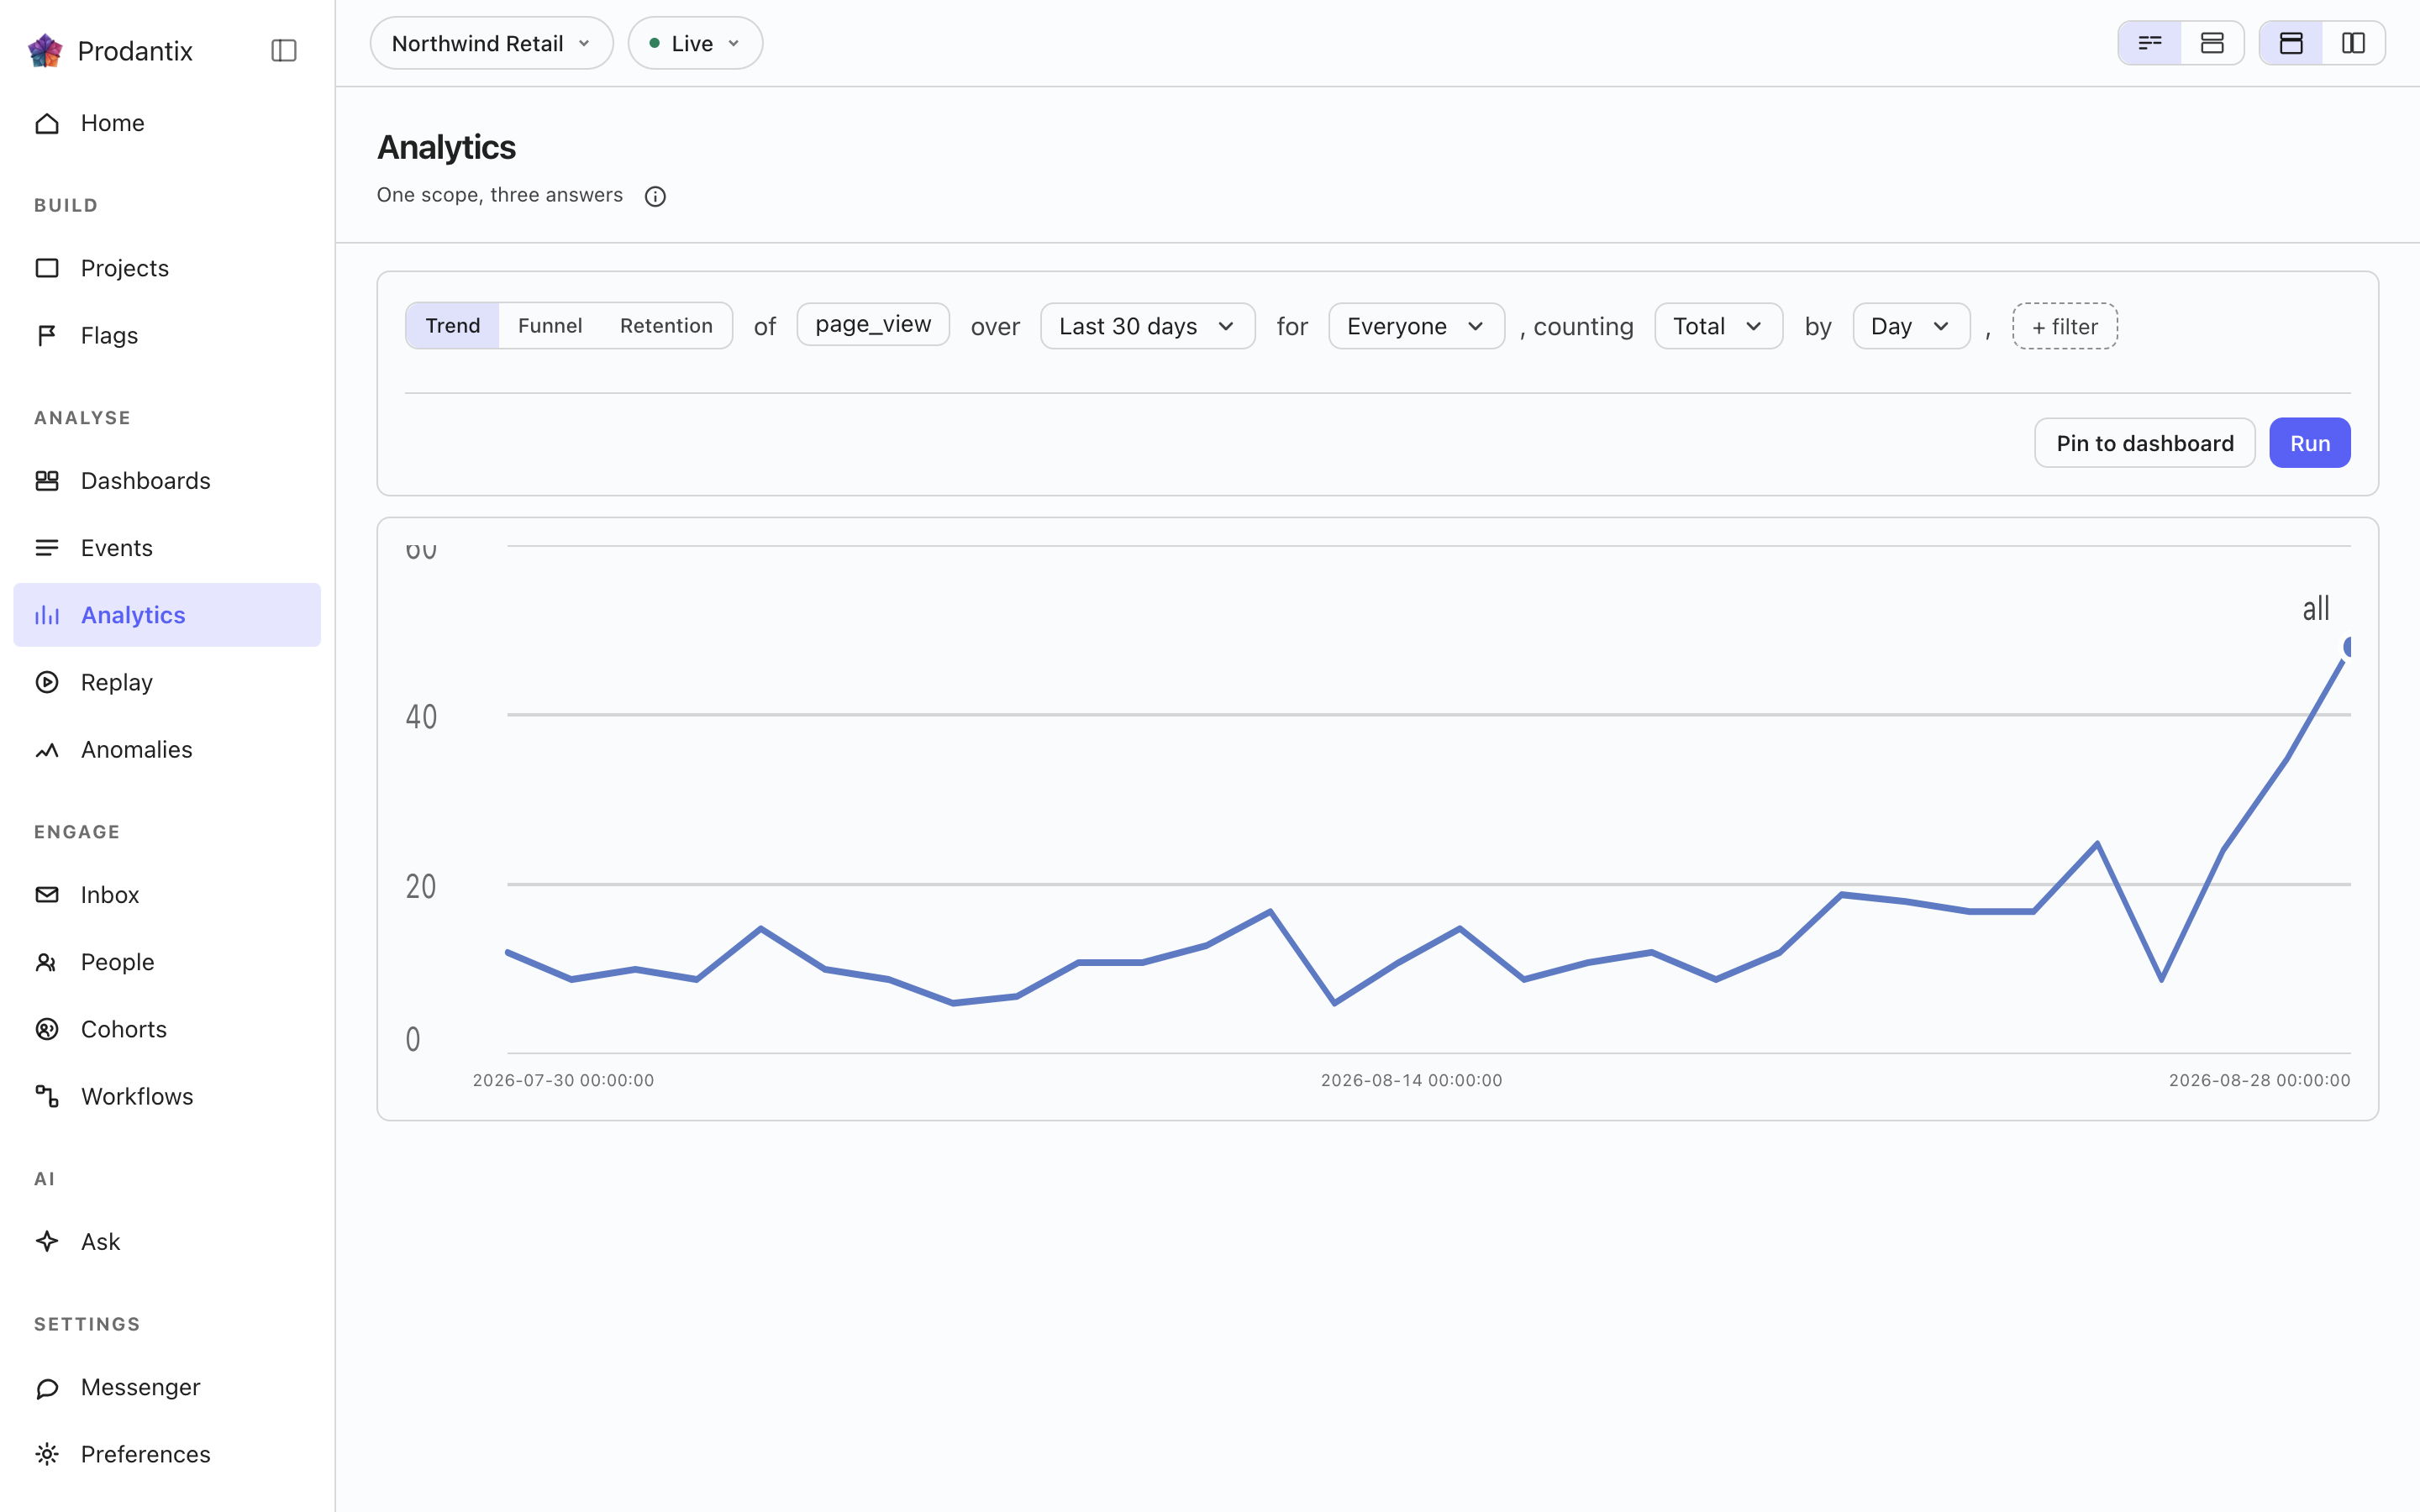
L'atelier : une question écrite comme une phrase et posée de trois façons, en tendance, en entonnoir ou en rétention. Le résultat se dessine sur place, et celui qui vaut d'être gardé s'épingle à un tableau de bord.
Six modes, one question
A trend counts one event over a range, as totals or unique people, at a granularity the range makes sensible. A funnel orders two or more steps and reports who made it through each. Retention asks who came back: an entry event, a return event and a matrix of periods. Paths asks what happened next, stickiness how many days a period's users came back on, and lifecycle who was new, returning, resurrecting or dormant in each period. Switching modes keeps everything the modes share, so a trend refined into a funnel does not start over.
Metrics and formulas


A trend is not one measure: Add a metric appends a letter, B onward, each its own event and its own total or unique users measure, the scope event staying letter A. Add a formula turns a row into an expression combining those letters with decimal numbers and + - * /, grouped with parentheses, up to 200 characters and never another formula's own letter. A point the formula cannot compute, a division by zero among them, draws as a gap rather than a zero.
The compared period


Compare asks the same question again over the window right before this one: Previous Period, Previous Day, Previous Week, Previous Month, Previous Quarter or Previous Year. Every series in the result gets a past twin, drawn apart from the current one rather than as a plain extra line, and the scope note names which one is picked. The compared period draws on Line, Stacked Line, Column, Stacked Column, Bar, Stacked Bar, Table and Metric; Pie draws the current period only.
Breakdowns


Breakdowns split a trend by up to three fields at once, an event property or one of the columns the DSL allow-lists: every series in the result carries the tuple of values it is one combination of, in the breakdowns' own order. The table reads every combination as its own row; the other chart types read the first breakdown as the series and fold the rest into its key.
Paths: what happened next


Paths start from an anchor event and walk one to five steps forward, or backward, within the anchor's session or a window of minutes or hours. Each step reports its top three, five or ten events with the share of that step's users, the events past the top folded into one row, and the users who took no further step. The default reading is one column per step; the same result reads as a sankey, with a block per event and a ribbon into each block of the next step, or as a tree that nests the next step's events under each event until its caret opens it.
Step by choisit ce qu'est une étape. Par événement, la marche est constituée des principaux noms d'événements après l'ancre. Par page, elle ne considère que les vues de page et la clé de chaque étape est l'hôte avec le chemin, si bien que la marche se lit tarifs, inscription, paiement plutôt que vue de page, vue de page, vue de page. L'ancre change avec elle : le champ d'événement devient un sélecteur sur les pages que les visiteurs ont réellement atteintes dans la période, les cent premières par utilisateurs, car une ancre de page saisie à la main devrait correspondre exactement à un hôte et à un chemin pour répondre quoi que ce soit. Dans le sankey et dans l'arbre, une étape de page dessine le chemin avec son hôte en préfixe discret, de sorte que deux hôtes partageant un chemin restent distinguables.
Stickiness: how many days


Stickiness counts, for each week or month, how many of the event's users were active on one, two, three and more of its days. The result row steps between periods; the column chart reads one period at a time, and the table reads all of them.
Lifecycle: new, returning, resurrecting, dormant


Lifecycle sorts each period's users into four states: new were first seen in the period, returning were active in it and the period before, resurrecting came back after a period away, and dormant were active the period before and not in this one. First-seen reads the whole retained history, so a user is new once; activity is read one period before the range, so the first period's returning and dormant counts are real rather than zero by construction. The stacked column draws dormant below the zero line; the table adds a net column.
The sentence and its clauses


The question reads as a sentence: measure, event, range and any clauses, each word an editable control with the project's own event names suggested as you type. Property clauses narrow by what an event carried; a cohort clause scopes the whole question to a saved cohort. Whether the question composes as one sentence or as labelled groups is a stored preference, as is the split or stacked layout; nothing runs until Run, so a half-edited question never fires.
Mesures, événements et exclusions
Chaque métrique compte ses événements au total ou en utilisateurs uniques, ou lit un nombre qu'ils portaient : le sélecteur de mesure regroupe Count, Sum of et Average of, les deux derniers listant chaque propriété que les événements de la métrique ont envoyée comme nombre, et la ligne se lit alors the sum of amount. Le champ d'événement d'une métrique accepte jusqu'à 8 événements, comptés ensemble comme une seule série sous la lettre de la métrique et étiquetés avec chaque événement compté. Dans une tendance, Exclude après la cohorte écarte People who did an event, c'est-à-dire qui a fait l'un d'au plus 8 événements dans la période, A cohort autre que celle à laquelle la question est limitée, ou les deux ; chaque ventilation accepte aussi des valeurs à écarter. La période est le sélecteur de dates : Today, Yesterday, Last 7 days, Last 30 days, Last 3 months, Last 6 months et Last 12 months, ou toute suite de jours choisie sur son calendrier de deux mois. Les jours sont des jours UTC, comme l'entrepôt les compte, et une période relative est enregistrée par son nom, si bien qu'un rapport enregistré sur Last 30 days lit toujours les 30 derniers jours. Sur le réseau, une métrique porte ses événements supplémentaires dans orEvents, la requête porte excludeDid et excludeCohort, et la liste des propriétés est numericProperties sur eventCatalog.
Reading a result as another chart


Every result row ends with the chart type it is read in. The menu lists Line, Stacked Line, Column, Stacked Column, Bar, Stacked Bar, Pie, Table, Metric, Funnel Steps, Retention Curve, Ranked Columns, Sankey and Tree, in that order, with the ones the result cannot take greyed rather than hidden. A trend, a stickiness period and a lifecycle take any of the series types; funnel steps take a funnel; the retention curve draws one line per cohort over its matrix; ranked columns, the sankey and the tree read paths; the table reads everything. Each mode remembers the type you chose, the URL carries it as ?chart=, and a pinned tile keeps it.
Réglages du graphique
Le bouton de réglages à côté du type de graphique ouvre les réglages propres au graphique, en popover, en panneau à côté du graphique ou en boîte de dialogue, selon ce que nomme le sélecteur de mise en page. Les onglets Left axis et Right axis règlent si chaque axe s'affiche, son titre, son unité (nombre, devise, pourcentage ou personnalisée), un préfixe et un suffixe, l'abréviation des grands nombres, le nombre de décimales avec un aperçu du résultat, des bornes minimum et maximum fixes au-delà desquelles les valeurs sont ramenées au bord ou omises, et une échelle linéaire ou logarithmique. L'onglet Time axis affiche ou masque l'axe du temps, lui donne un titre et ombre les week-ends d'un graphique par jour ou par heure. L'onglet Series place chaque métrique ou formule sur l'axe gauche ou droit, ce que fait aussi la ligne propre à chaque métrique dans la question, et choisit la palette Standard ou une palette sûre pour les daltoniens. Chaque changement redessine le graphique aussitôt ; un rapport ou un insight enregistré garde ses réglages, son historique de versions nomme leur changement, et une tuile épinglée se dessine avec eux, sur le téléphone aussi. Sur le réseau, ils voyagent dans le champ chart à côté de viz sur les rapports, les insights et les tuiles.
Le tableau des résultats
Sous le graphique, le tableau des résultats d'une tendance liste une ligne par série : la pastille dans laquelle sa courbe est tracée, ses valeurs de ventilation (ou sa métrique quand la question compte plusieurs lettres ou aucune ventilation), une colonne Somme et une colonne par période, avec à côté de chaque période son jumeau passé quand la tendance est comparée. Décocher la case d'une ligne, ou cliquer sur sa pastille, retire sa courbe du graphique ; la ligne reste dans le tableau, atténuée avec une pastille creuse, la légende la garde creuse, et la case de l'en-tête remet toutes les lignes ou les retire toutes. Le champ de recherche au-dessus du tableau réduit ses lignes à celles dont les valeurs contiennent le texte saisi, et ne retire jamais une courbe du graphique. Le groupe d'affichage de la ligne de résultat bascule entre Graphique, Tableau et Graphique et tableau, l'affichage à l'ouverture d'un résultat ; avec le type de graphique Tableau, le tableau est le graphique et le groupe s'efface. L'affichage et les lignes retirées sont enregistrés avec le rapport dans ses réglages de graphique, comme view et hidden dans le champ chart, si bien qu'un rapport enregistré, un insight et une tuile épinglée tracent les mêmes courbes, sur le téléphone aussi. Les autres modes montrent leur propre tableau sous le graphique, avec la recherche et sans choix de lignes.
La ligne au-dessus du graphique indique depuis combien de temps le résultat a été exécuté, et Actualiser, à côté des paramètres du graphique, pose à nouveau la même question. Les modifications apportées à la phrase depuis attendent Exécuter.
Agir sur un point
Cliquer sur un point d'un graphique ouvre un menu titré par le point lui-même : sa série, son intervalle et sa valeur ; sur le téléphone, un appui long ouvre le même menu. Ce rapport modifie la question et la relance. Zoomer resserre une tendance ou un cycle de vie sur l'intervalle cliqué, un cran plus fin : un mois en semaines, une semaine en jours, et le jour d'une tendance en heures. Sur un point d'une ventilation, la ligne de filtre ajoute un filtre pour chacune de ses valeurs et la ligne d'exclusion retire une valeur de sa ventilation, une ligne par valeur ; sur un point sans ventilation, les deux restent grisées sous les noms Filtrer sur ceci et Exclure ceci. Examiner de plus près liste qui et quoi ont fait le point, dans chaque mode : un intervalle de tendance ou de cycle de vie, une étape d'entonnoir, une cellule de rétention, un événement d'un parcours et une colonne d'adhérence nomment chacun les leurs. Voir les utilisateurs, Voir les événements et Voir les relectures les ouvrent dans une boîte de dialogue par défaut, ou dans un panneau latéral ou sur la page elle-même, selon le sélecteur de la page d'analyse. Ouvrir dans Personnes, ou Événements, ou Relecture, porte le point sur cette page, où une puce le nomme et l'efface ; quand le sélecteur envoie le point directement sur la page, Retour au rapport ramène à la question. Expliquer contient Analyse des causes profondes : sur un point de tendance précédé d'un intervalle, qui compte des totaux ou des utilisateurs uniques, elle rédige dans Ask la question de savoir pourquoi la courbe a monté ou baissé entre les deux. Côté API, le point voyage dans l'argument point de projectPeople et de replaySessions et dans le filtre de events : le type et la requête du rapport, plus l'intervalle, l'étape, l'événement, la cohorte, la période, les jours actifs ou l'état qui le désignent.
Annotations
Ajouter une annotation, dans le menu d'un point, marque ce jour, ou une période choisie dans le calendrier, d'une note et de jusqu'à dix étiquettes. Sur un rapport, Affichée sur la garde sur le rapport ou l'affiche sur chaque graphique du projet dont les dates la couvrent ; une question qui n'est pas enregistrée comme rapport l'affiche sur les graphiques du projet. Un repère se place sur l'axe des dates : le survoler trace sa ligne et une carte avec la note, les étiquettes, les jours et son auteur, et un clic garde la carte ouverte avec Éditer et Supprimer pour son auteur et pour toute personne autorisée à écrire des annotations. L'onglet Annotations des paramètres du graphique les liste et masque les étiquettes que vous désactivez, enregistrées avec le rapport, et les tuiles d'un tableau de bord tracent les mêmes repères. Dans l'API, ce sont annotations, createAnnotation, updateAnnotation, deleteAnnotation, l'abonnement annotationChanges et /v1/projects/{projectId}/annotations ; les agents les lisent et les ajoutent avec prodantix.annotations.list et prodantix.annotations.create.
Results, and keeping them
A trend draws as a series, a funnel as its steps with the drop between them, retention as a matrix whose rows are entry periods, paths as ranked columns per step, stickiness as columns over days active and lifecycle as a stacked column. Once a result exists, Pin saves the question to a board on Saved, where its tile re-runs the query on every open and draws it as the chart type it was pinned in.
À côté de Pin se tient Save. Sa première ligne est As an insight : la question est gardée entière, éditeur et graphique, sous un nom demandé dans une invite, et l'en-tête de la carte nomme alors l'insight ouvert sur une puce ; l'adresse porte ?insight=, le lien le rouvre donc. Modifiez la question et la puce lit changed après le nom jusqu'à ce que la première ligne de Save, désormais Update, écrive la modification par-dessus ce qui était enregistré, ou que sa seconde ligne, Save as a new insight, garde la modification comme un autre insight. La ligne suivante est Users as a cohort : elle nomme les personnes qu'un résultat a comptées et les garde en cohorte statique. La liste est matérialisée sur le serveur à partir de la requête telle qu'elle a tourné, si bien qu'elle tient tous ceux que le résultat a comptés plutôt que ceux que le graphique a dessinés, jusqu'à 100,000, et un résultat qui n'a compté personne est refusé. La cohorte garde la phrase sous laquelle elle a été lue et, liste fixe, n'est jamais réévaluée : la même question posée la semaine prochaine répond sur la semaine prochaine, tandis que la cohorte tient toujours qui elle a compté aujourd'hui. Les insights enregistrés sont listés dans l'onglet Insights de Saved. Sous un séparateur se trouve Exporter en CSV : le serveur écrit le résultat en feuille de calcul à partir de la requête telle qu'elle a été exécutée, une ligne par période et par ventilation avec une colonne par lettre de métrique, toutes les combinaisons jusqu'au millier du moteur plutôt que les quelques premières du graphique, et nomme le fichier d'après l'outil et la plage. En dernier vient Surveiller un seuil, actif seulement sur un résultat de tendance : il enregistre le résultat comme insight s'il n'en est pas encore un, puis énonce une limite sur sa première métrique, au-dessus, en dessous ou changeant d'une valeur, vérifiée une fois par jour sur le dernier intervalle complet de l'insight ; tant que la limite est franchie, l'insight est listé dans Requiert votre attention et l'insight rouvert dessine la limite comme une bande sur son graphique, et l'alerte se dissipe d'elle-même quand la valeur revient.
Save as report garde la question comme rapport sur un tableau, en deux étapes : le nom et une description d'abord, puis le tableau, choisi dans une liste avec recherche haute de trois lignes, New board dessous. L'adresse porte alors ?report=, l'en-tête de page lit projet › tableau › rapport, le tableau étant un lien, et l'en-tête de la carte nomme le rapport ouvert sur une puce, qui lit changed après le nom dès que l'éditeur diffère de ce qui est enregistré, jusqu'à ce que Save report écrive la modification comme version suivante ou que Save as new report la garde comme un autre rapport. Un rapport ouvert, le menu Save le renomme aussi, le déplace vers un autre tableau ou le duplique ; un déplacement prend effet aussitôt et la snackbar le dit avec Undo. Sous la carte, la bande de versions nomme la version actuelle, qui l'a enregistrée et quand ; Show history déplie chaque version, ce qui a changé, par qui et quand, trois entrées visibles, avec Restore à côté de chacune sauf l'actuelle, et une restauration écrit une nouvelle version copiant celle choisie plutôt que de réécrire l'historique. Les rapports sont listés dans l'onglet Reports de Saved.
Partager un rapport
Quand un rapport enregistré est ouvert, la ligne d'exécution propose Copy link et Share. Copy link copie l'adresse du rapport avec sa période, sa cohorte et ses filtres, et elle s'ouvre pour toute personne de l'entreprise autorisée à ouvrir le rapport. Share ouvre deux onglets, Teammates d'abord. Teammates envoie le rapport à 20 personnes de l'entreprise au plus, avec une note si vous en ajoutez une : chacune le reçoit dans les notifications de la console, en notification push là où elle les a activées, et par e-mail. La boîte de dialogue reste ouverte et indique à qui il a été envoyé.
Public link crée une page en lecture seule que toute personne disposant du lien peut ouvrir sans se connecter : le rapport tel qu'à sa dernière exécution, avec son graphique et ses chiffres mais sans les filtres, la cohorte ni les personnes de sa question, et chaque exécution du rapport tel qu'enregistré l'actualise. Le lien cesse de fonctionner à la fin du jour choisi, de demain à 90 jours au plus, In 30 days au départ ; choisir un autre jour pendant qu'il est actif le renouvelle, et le désactiver l'arrête aussitôt. Créer un lien public demande une permission propre, que les agents n'ont jamais, et un rôle qui ne l'a pas voit l'interrupteur désactivé, avec une ligne qui le dit.
Where this meets the API
The concept is the Analytics pillar. On the wire, the six modes are six queries: runQuery, runFunnel, runRetention, runPaths, runStickiness and runLifecycle, with event names suggested from eventCatalog and, for a path stepping by page, the anchors from pathsPages (GraphQL reference). Pinning writes the question into a board through updateDashboard, with the report's kind and the chart type beside its query; saving an insight is createInsight, Update is updateInsight, and Saved's Insights tab reads insights. Save as report is createReport, Save report is updateReport, the strip's Restore is restoreReportVersion, and Saved's Reports tab reads reports. Sharing reads the public link with reportPublicLink, turns it on or renews it with setReportPublicLink, turns it off with turnOffReportPublicLink and sends to teammates with shareReport, while reportShareChanges streams every change; a visitor's page reads /v1/shared-reports/{token} (API reference).