Peristiwa
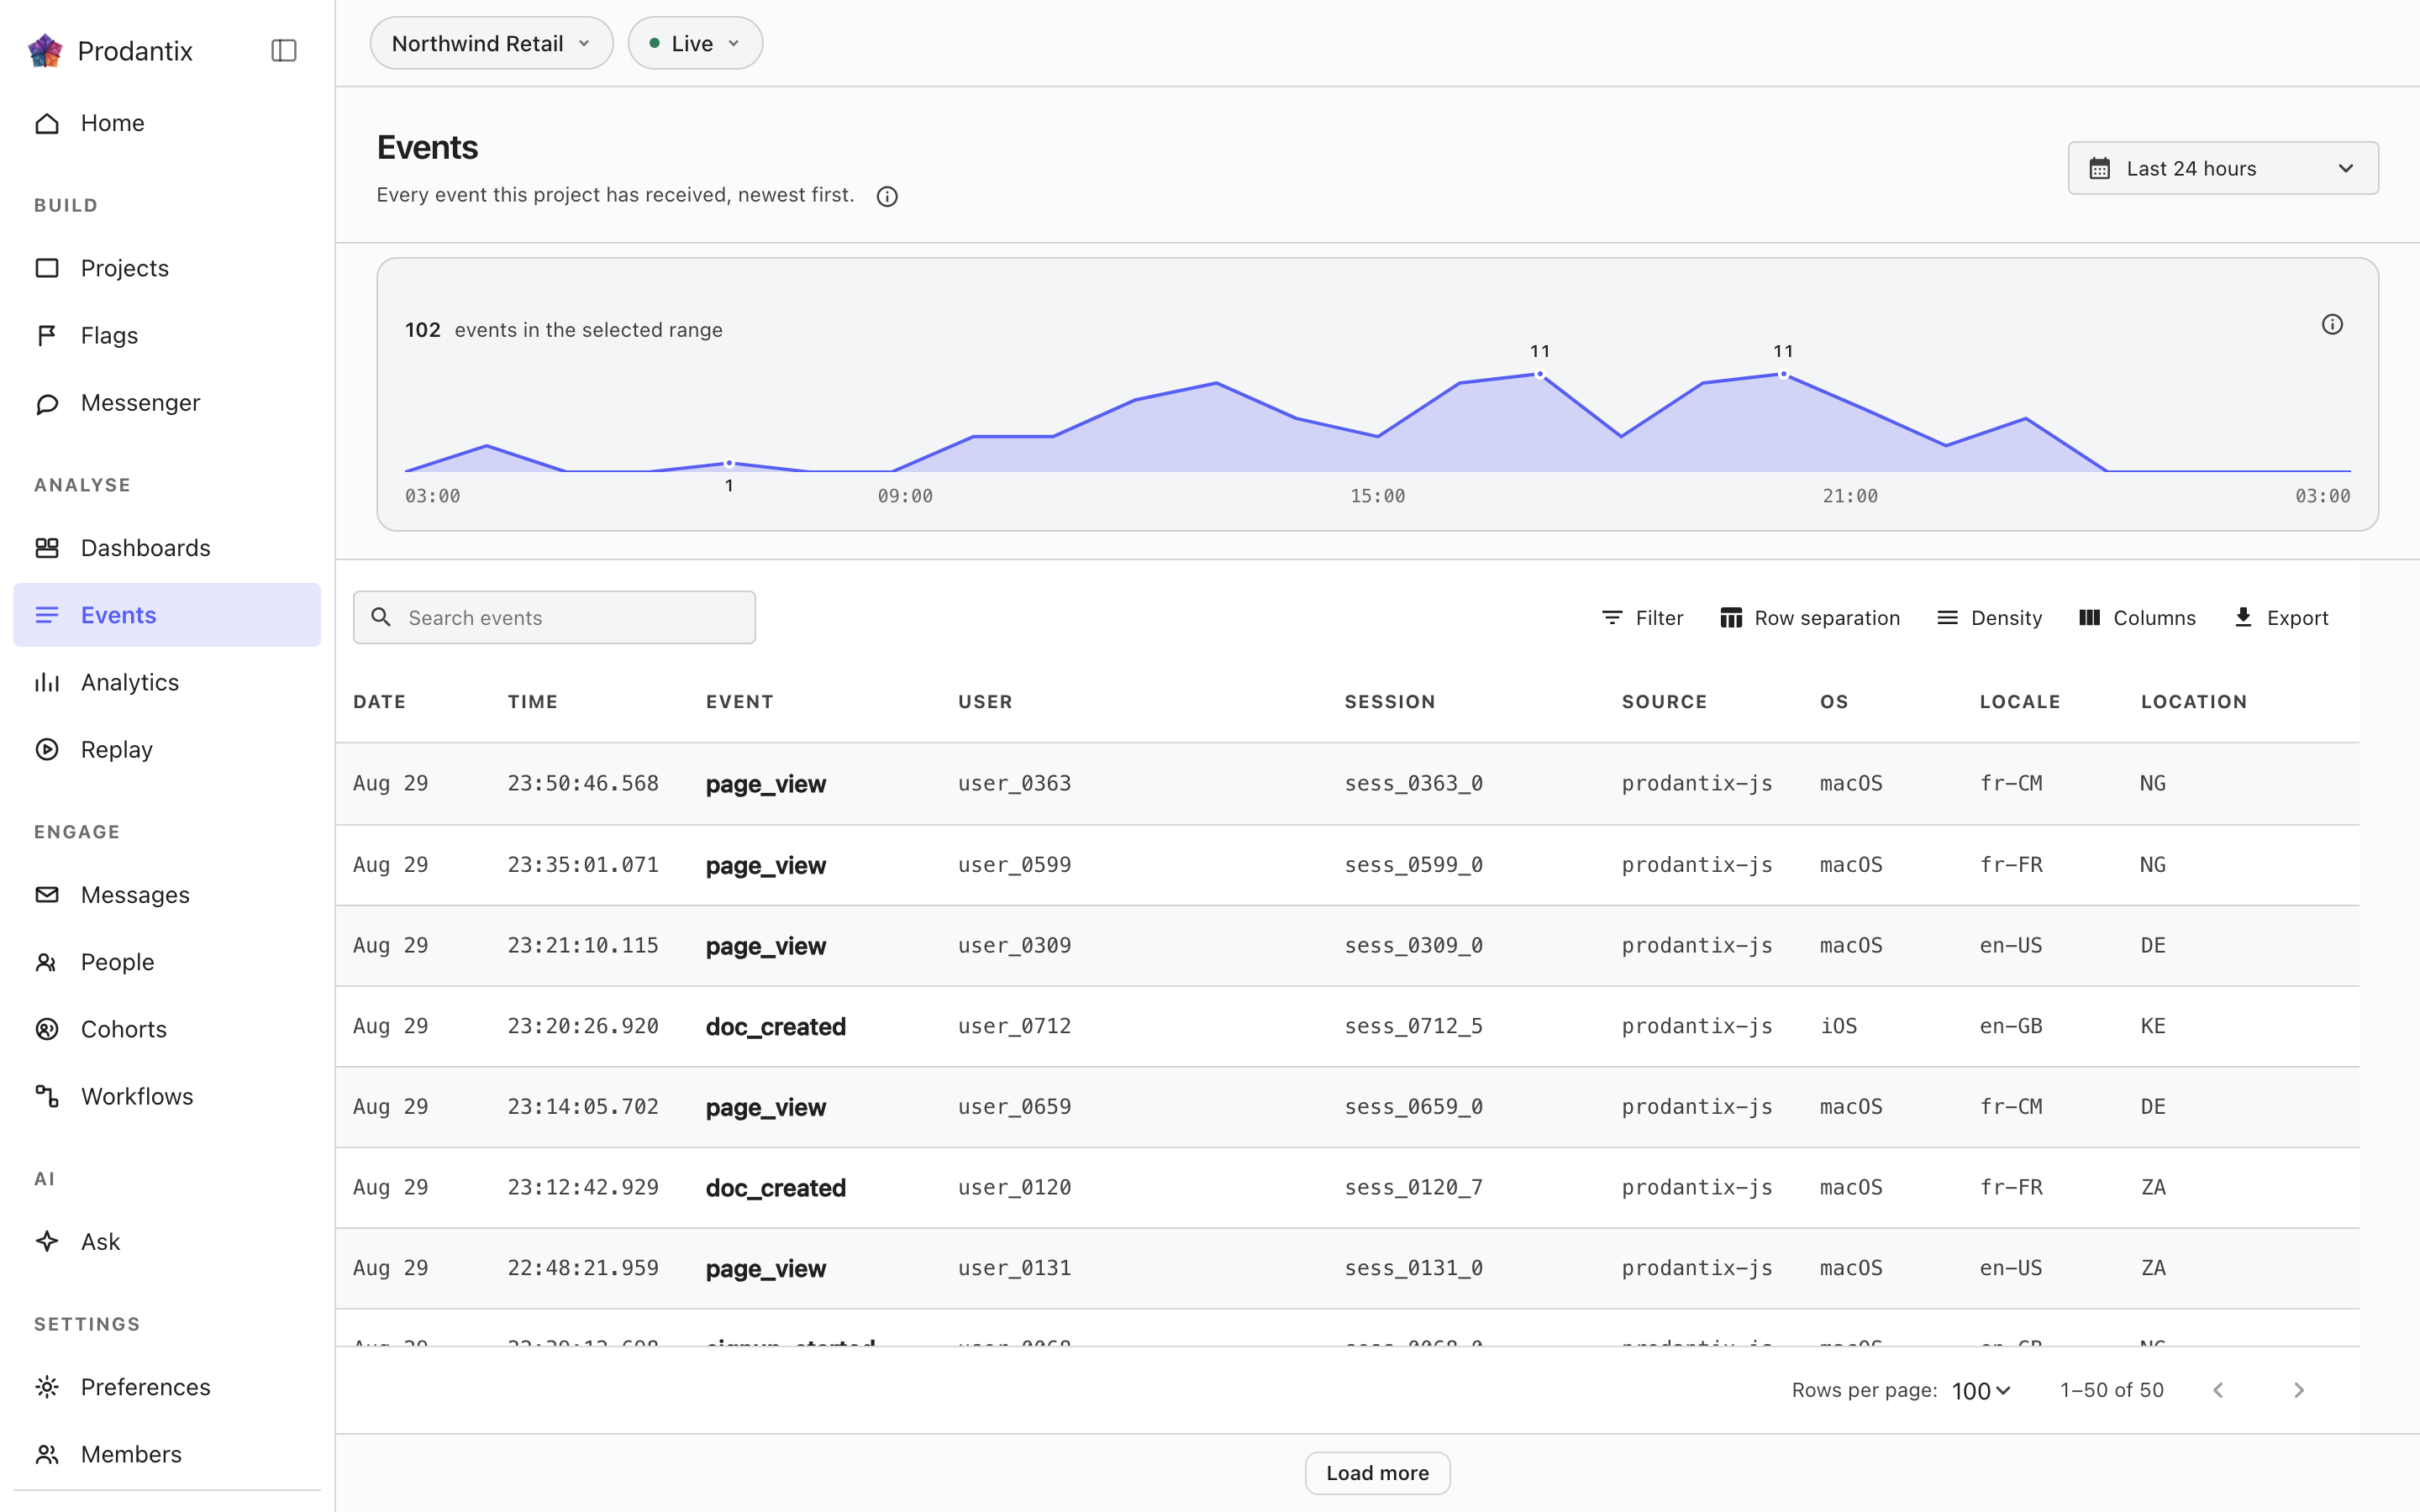
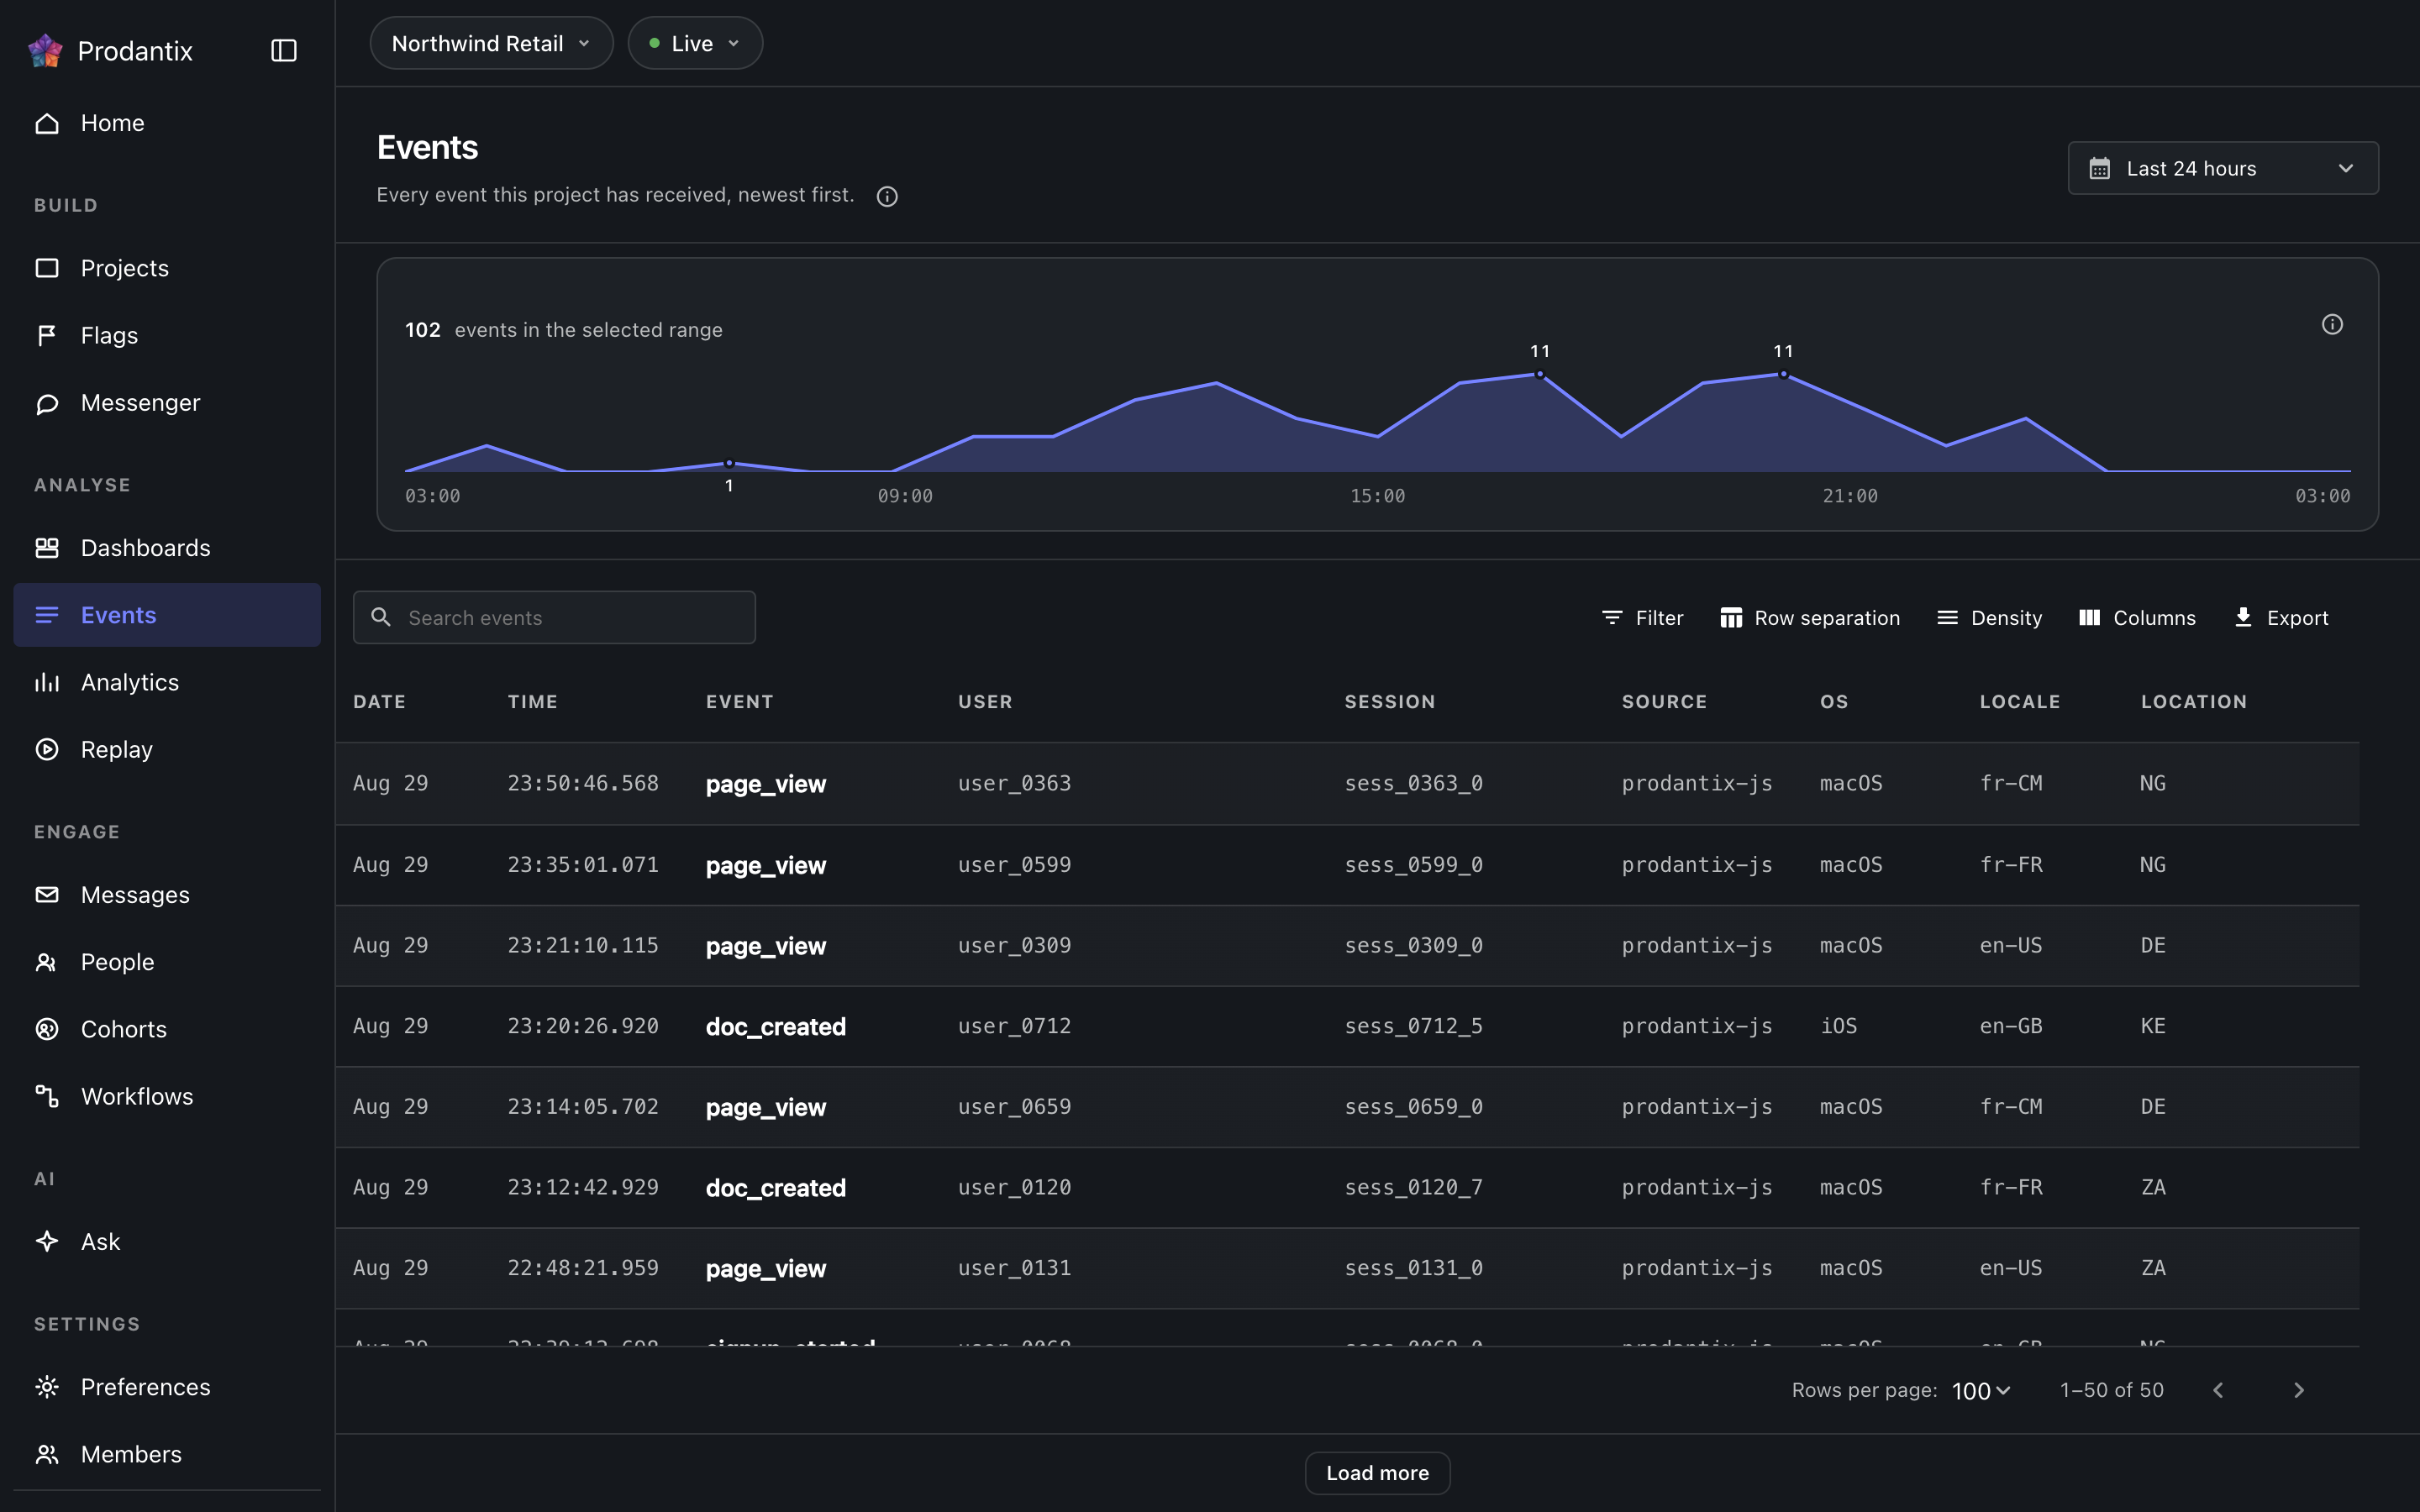
Aliran mentah: setiap peristiwa yang mencapai proyek, satu per baris, dengan histogram waktu di atasnya. Mengklik sebuah batang membatasi aliran ke bucket itu dan mengklik lagi membatalkannya; rentang tanggal tinggal di bilah alamat, jadi tautan yang dibagikan menampilkan apa yang sedang dilihat.
The histogram and the range
The band above the grid counts everything in range and draws it over time, at a granularity derived from the width of the range. Each bar is a filter: clicking one scopes the stream to that bucket, clicking it again returns the whole range. The range picker offers the usual presets and a custom span, capped at ninety days because the events table drops rows beyond retention; the chosen range rides the address bar, so a reload or a pasted link keeps it.
The grid
One row per event: name, when it happened (with its date, because a range can span days), who sent it and where from. The search narrows by name or person, more rows load with an explicit control rather than an infinite scroll, and in a live range newly ingested events stream into the top of the grid as they arrive. The glossary behind the info icon explains each column in place, and the names beginning with $, which the SDKs send on their own, are listed with their meaning on System events.
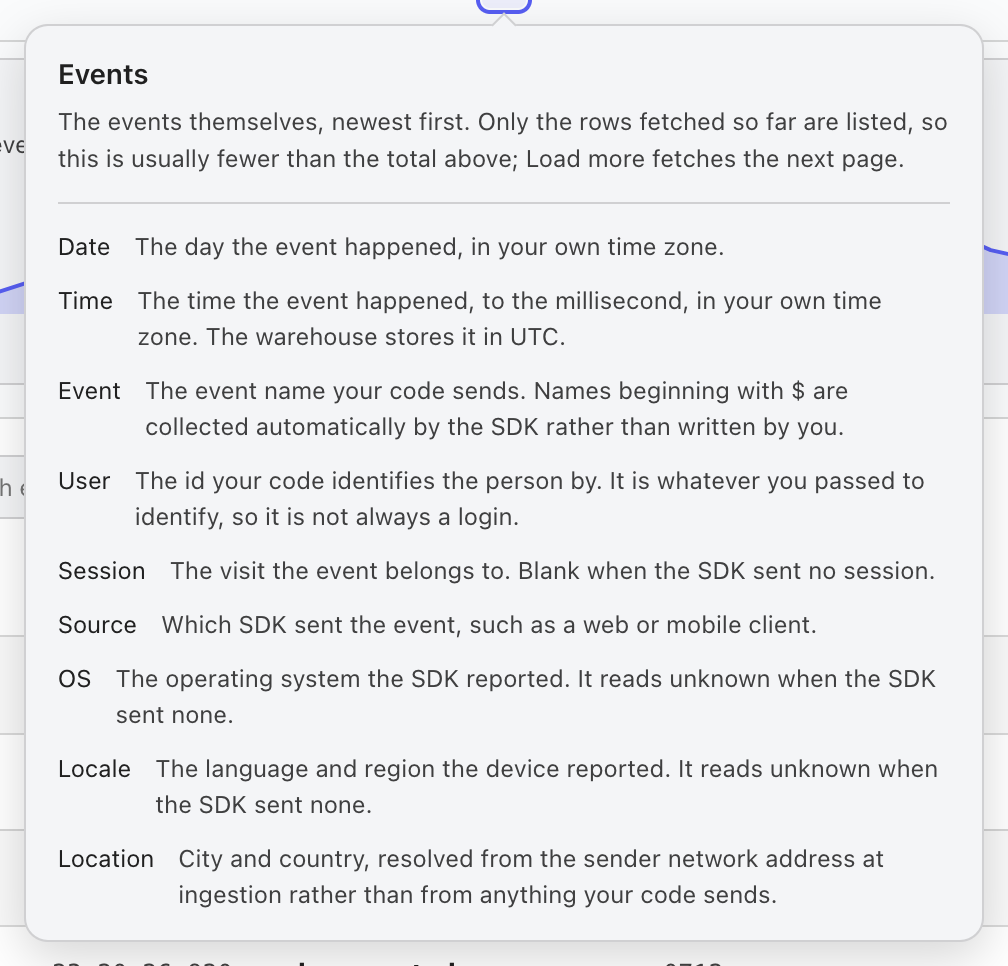
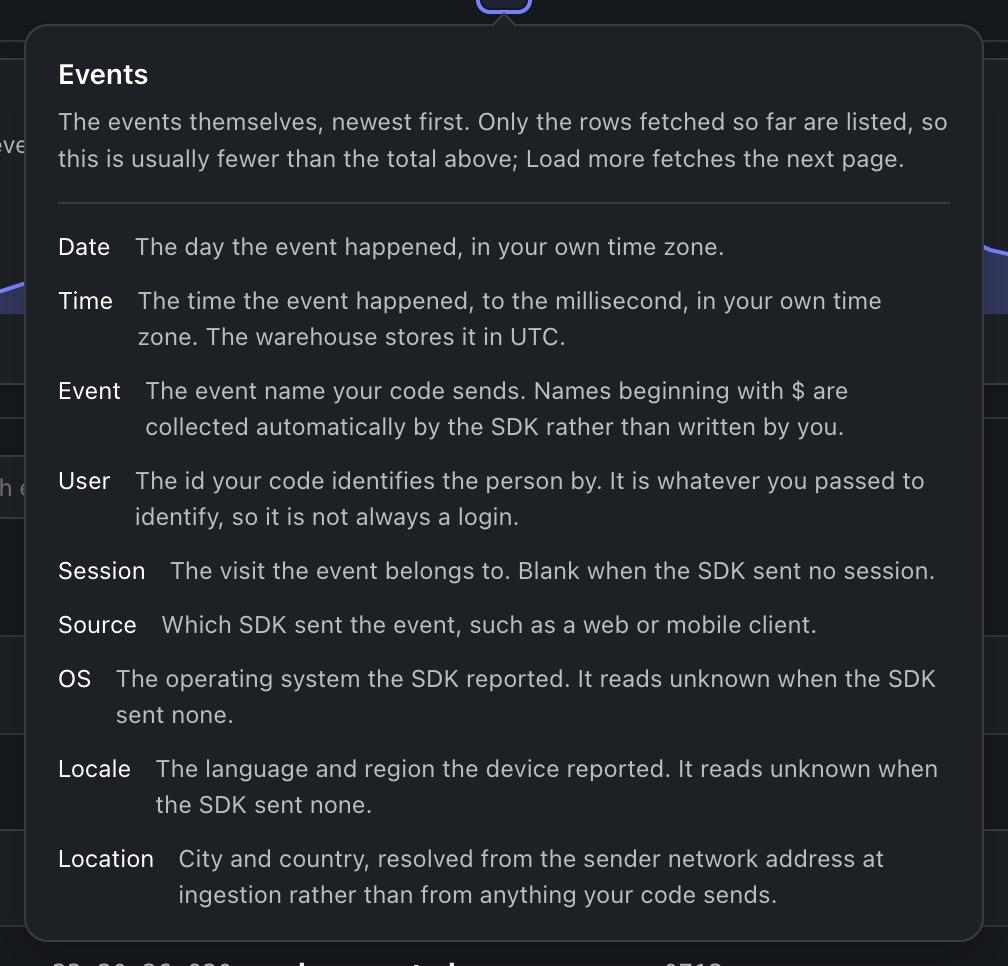
Selecting a row opens the event's properties as they arrived, one key per line, shown raw when they cannot be parsed because the unparseable copy is still the only copy.
Where this meets the API
How events are shaped is the Data model. On the wire: the grid is the events query, the band is eventVolume, and live ranges ride the eventsIngested subscription (GraphQL reference). Everything shown here arrived through event ingestion with the project's ingest key.