Tersimpan
Tempat apa yang Anda simpan dari workbench tinggal, dalam tiga tab. Papan: setiap papan adalah kumpulan tile tersimpan, dan setiap tile menjalankan ulang query-nya setiap kali dibuka, jadi angkanya hidup, bukan potret. Laporan: pertanyaan tersimpan yang tinggal di satu papan, dengan deskripsi dan riwayat versi. Wawasan: sebuah pertanyaan yang disimpan utuh, editor dan grafiknya, dibuka kembali di workbench dengan semuanya seperti semula. Setiap tab mencari berdasarkan nama; papan dibuat, diganti nama, digandakan dan dihapus, laporan diganti nama, dipindahkan, digandakan dan dihapus dengan Undo, wawasan diganti nama, disematkan ke papan atau dihapus.
Boards
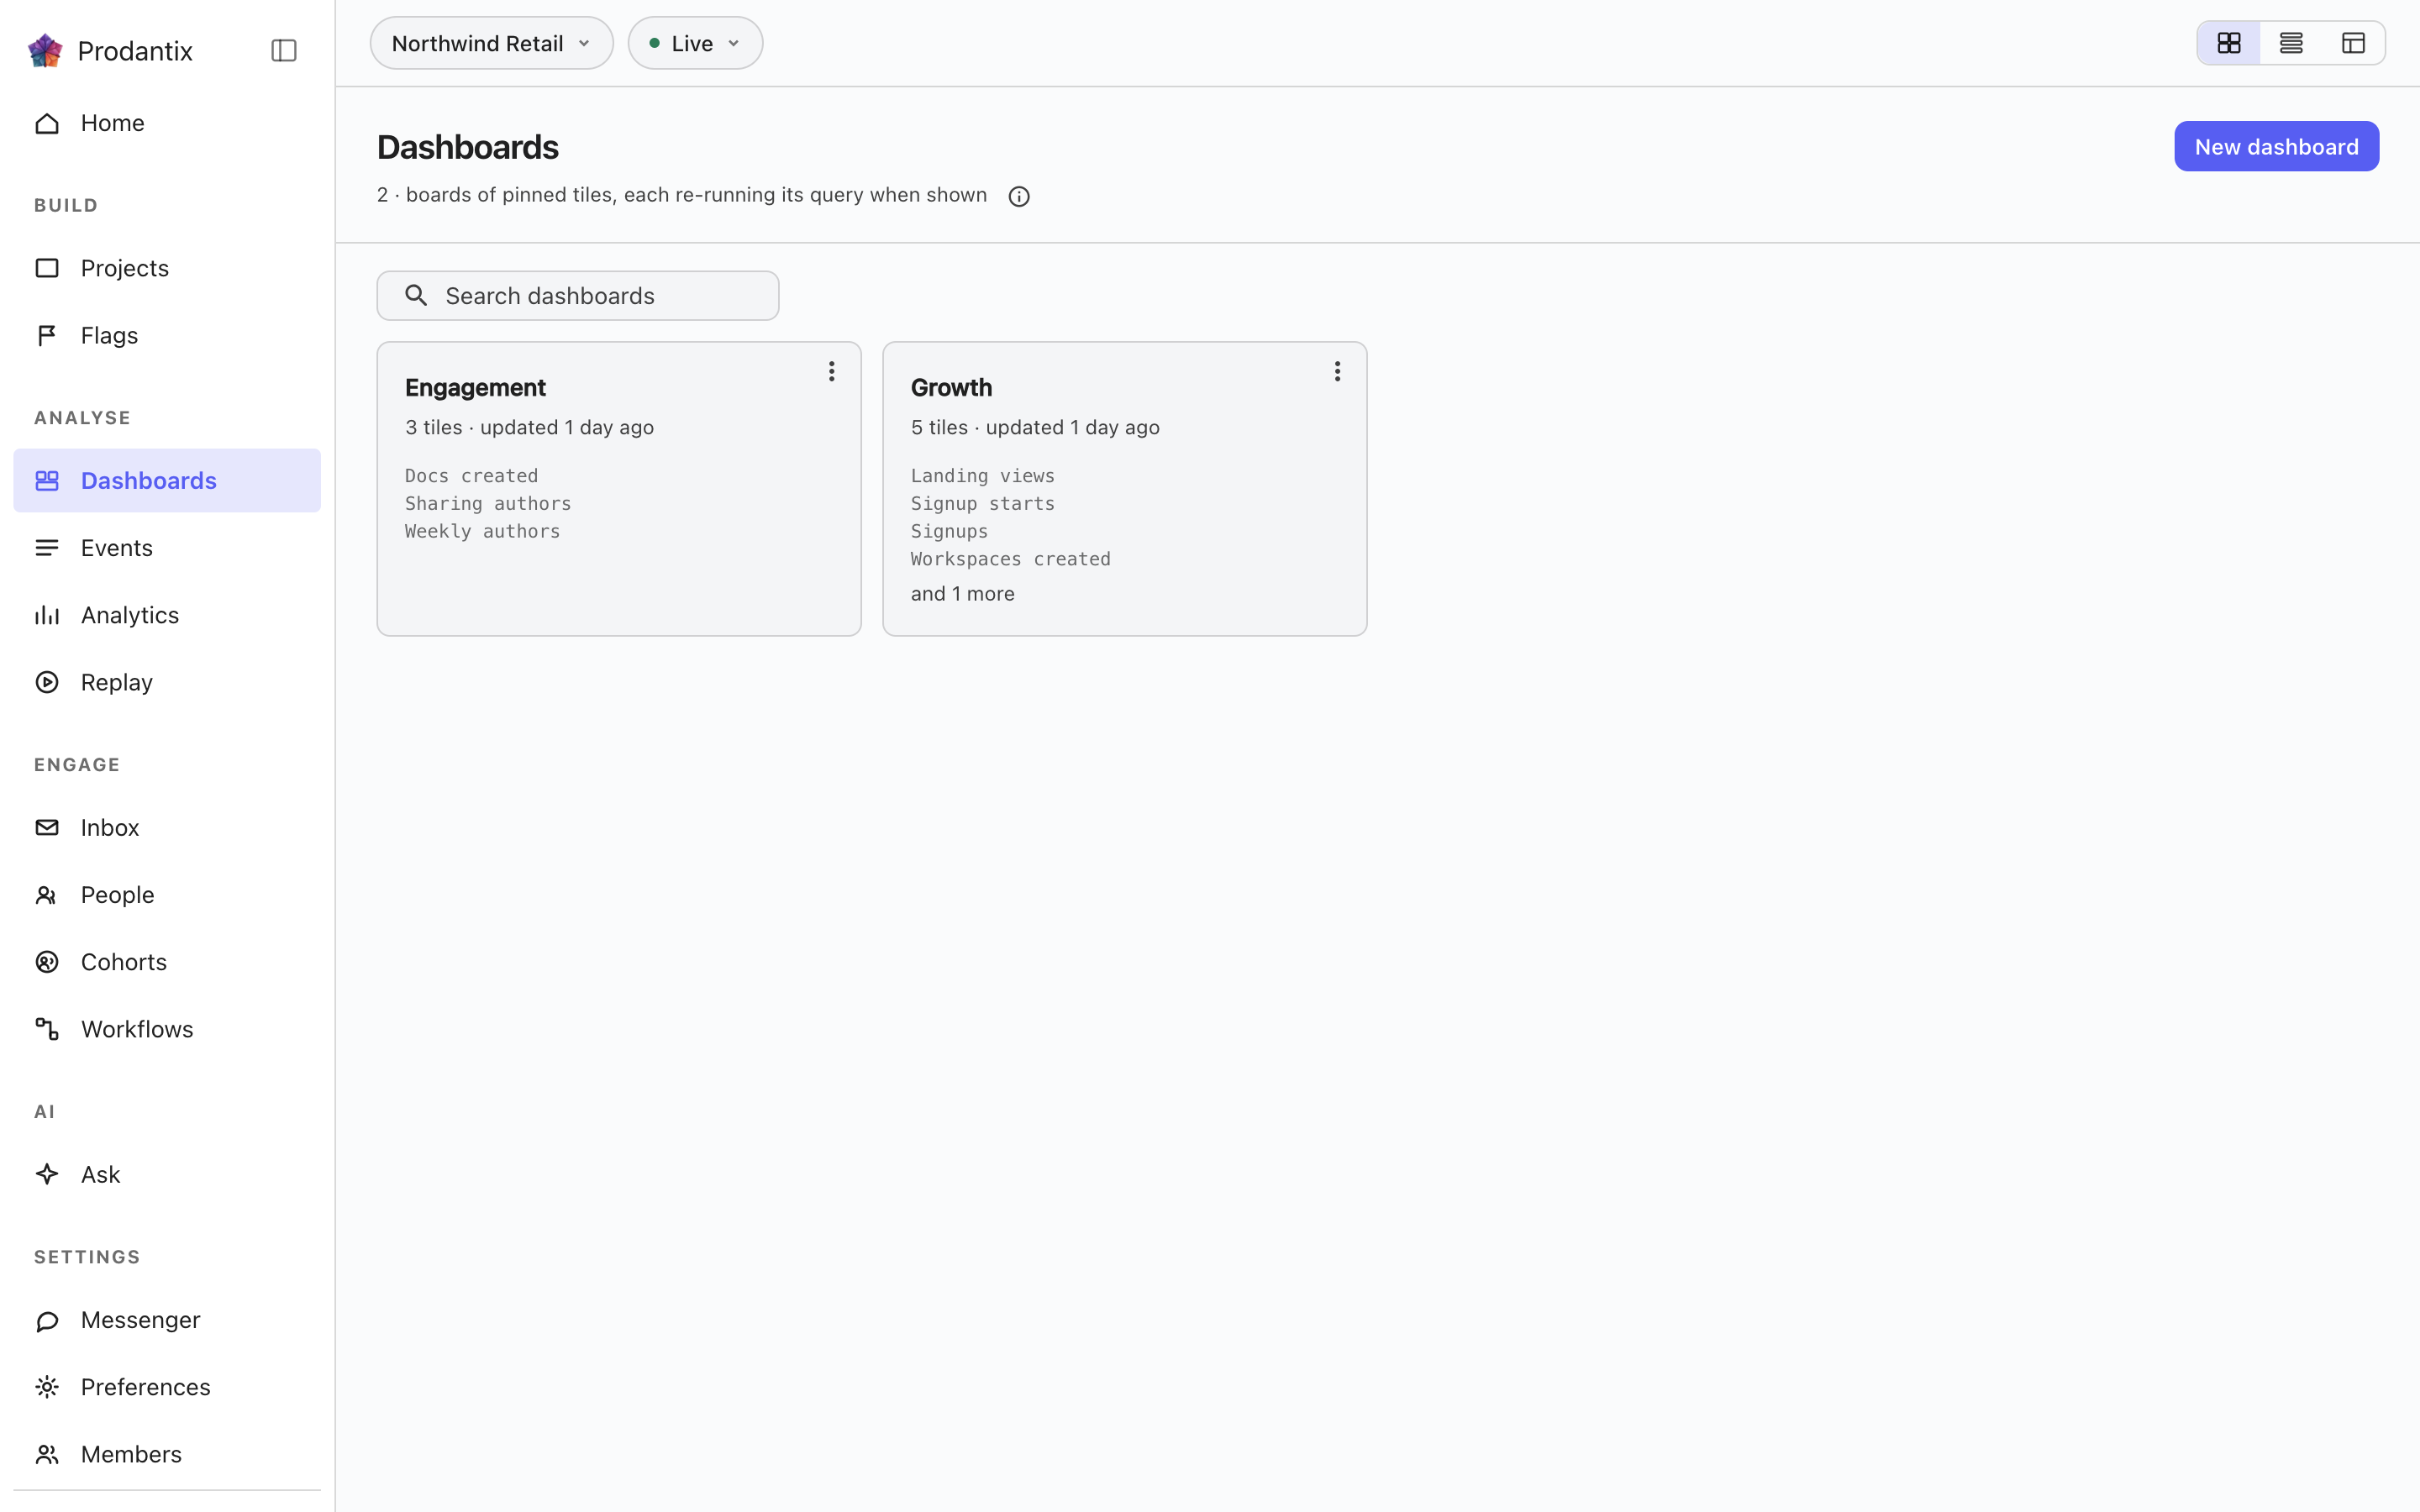
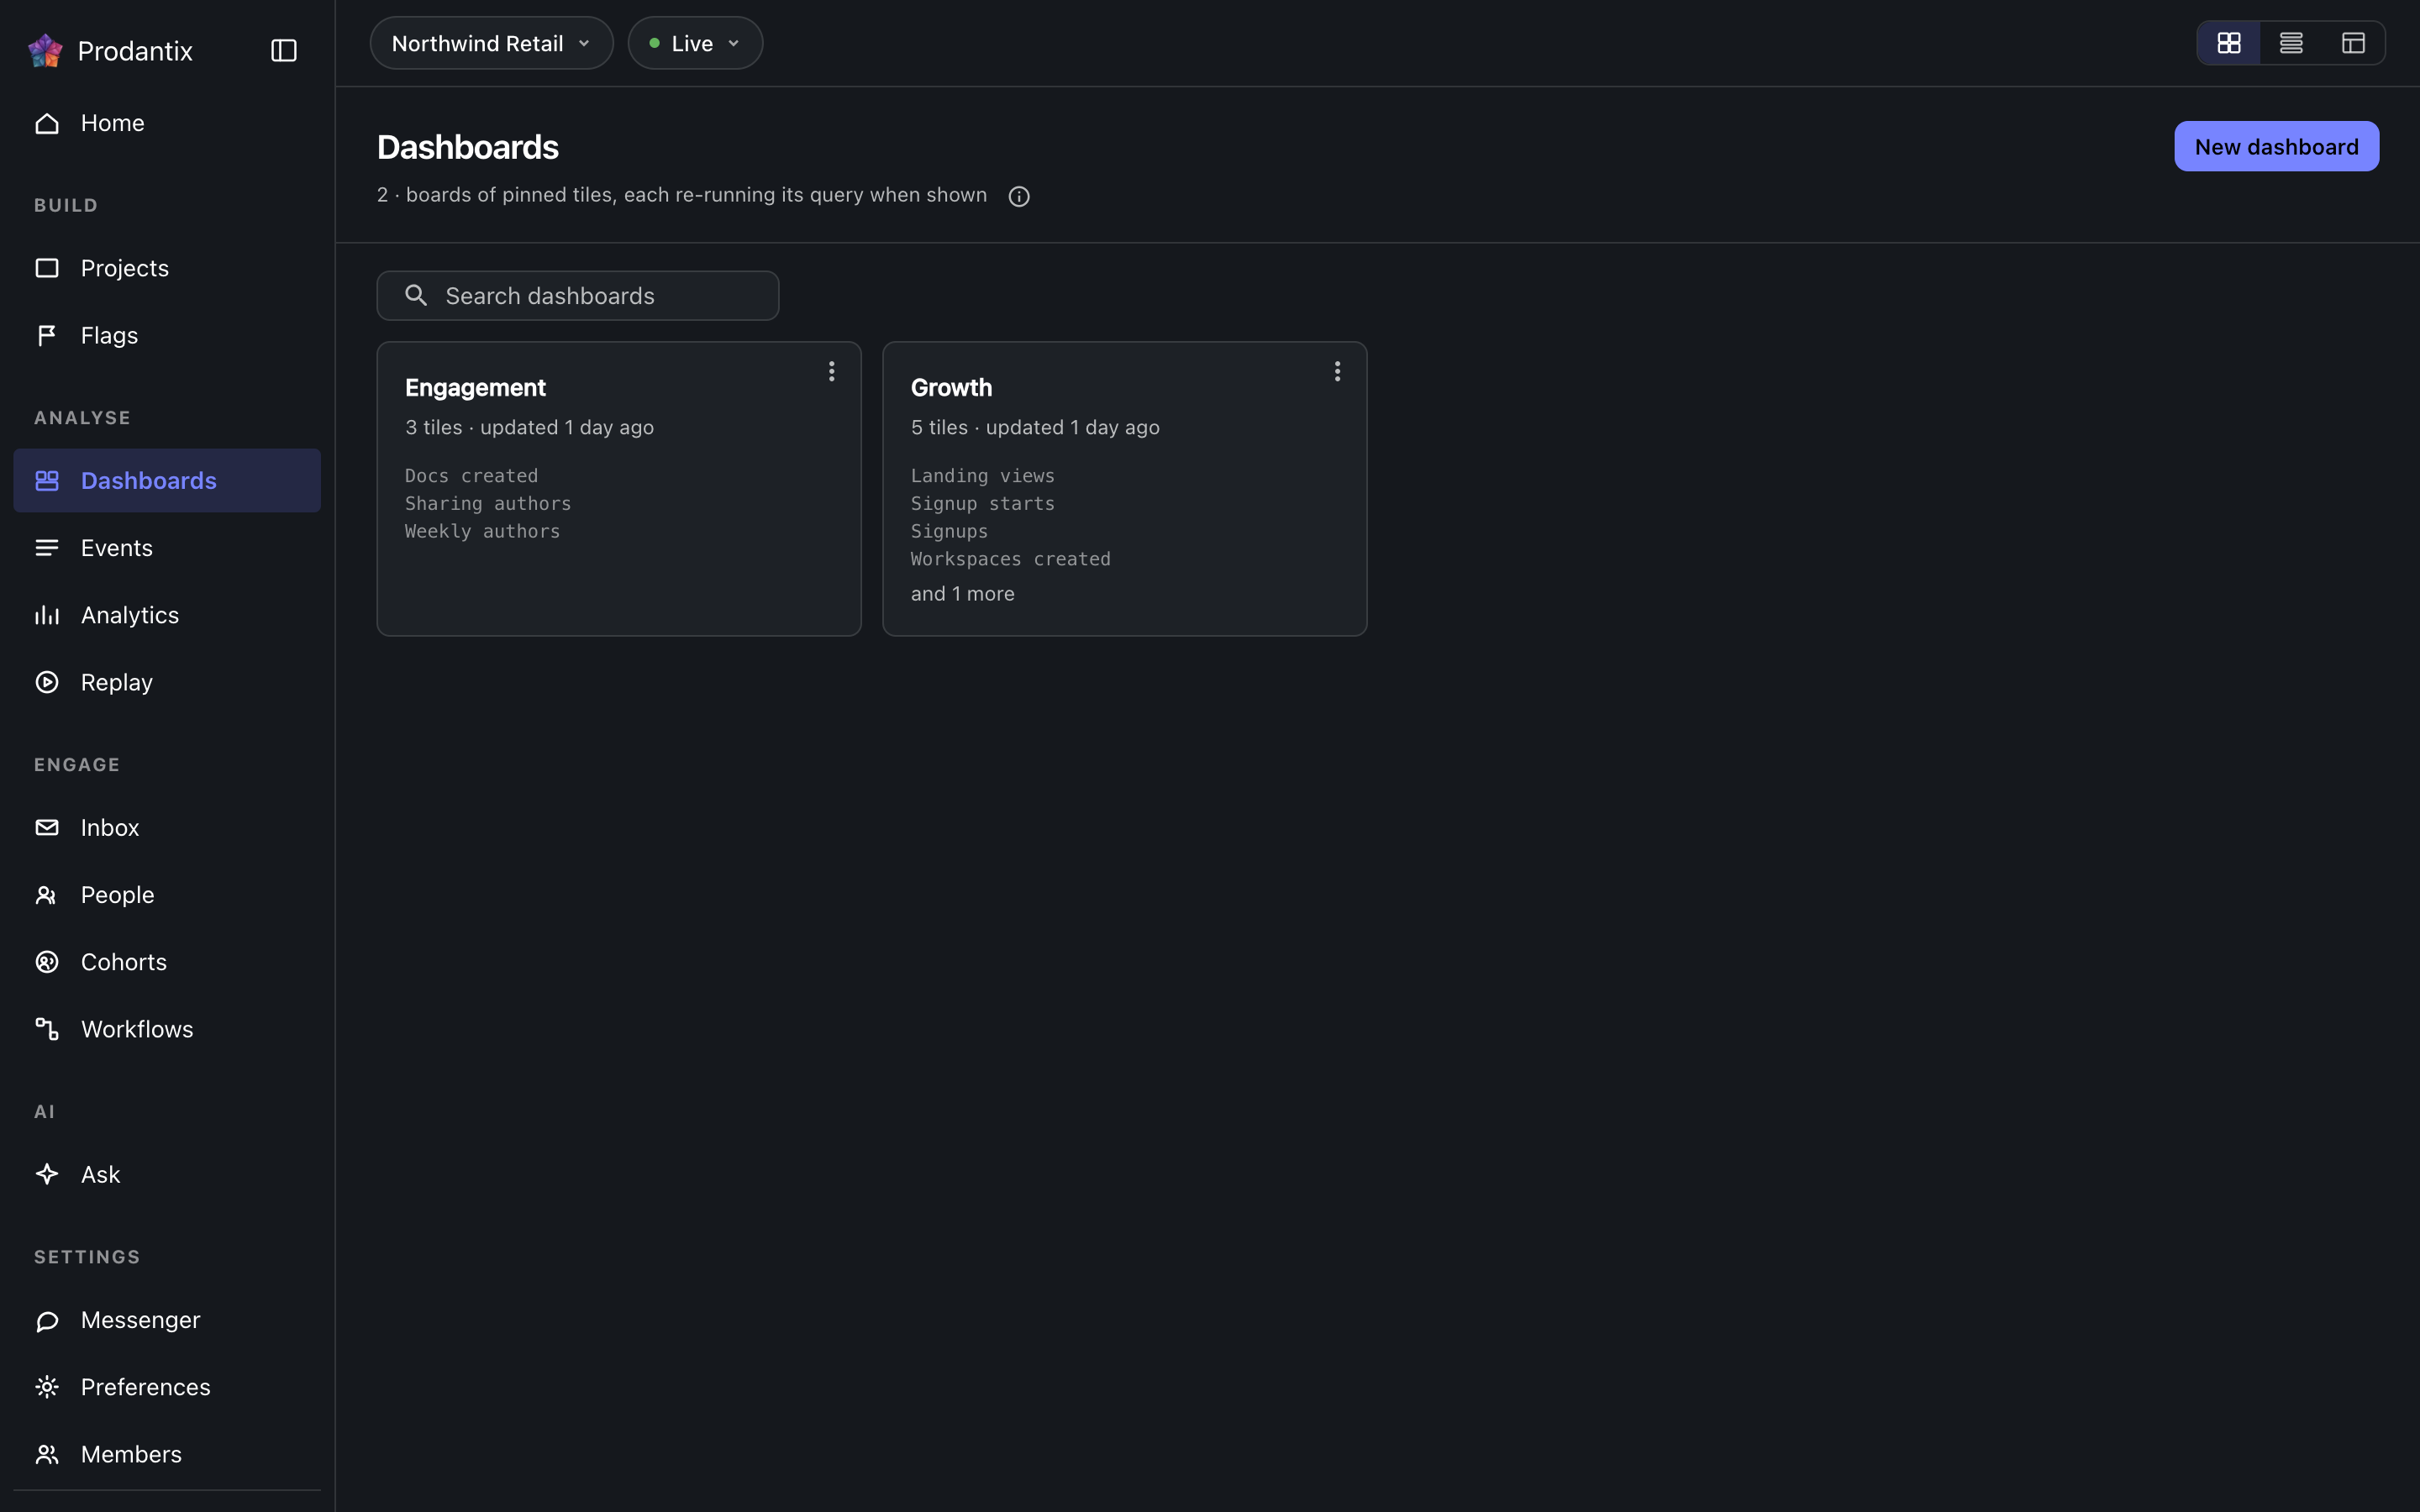
Every board in the project on the Boards tab, searchable by name, with the count in the page head describing the whole library rather than the narrowed view. New board names a board and opens it empty; a board's row menu renames, duplicates or deletes it, and deleting asks first because a board's tiles are the only copy of their saved questions. How the tab presents, as cards, rows or a table, is a stored preference per person, picked on the tab's own bar. Switching arrangements starts on the Growth plan; the Starter plan reads cards.
Reports
Laporan adalah pertanyaan tersimpan yang tinggal di satu papan, di bawah sebuah nama dan deskripsi, dengan setiap perubahan disimpan sebagai versi. Ia disimpan dari menu Save di workbench, Save as report, dalam dua langkah: pertama nama dan deskripsi, lalu papan tempatnya tinggal, dipilih dari daftar yang dapat dicari setinggi tiga baris dengan New board di bawahnya. Tab Reports mencantumkan setiap laporan dalam proyek sebagai kartu: nama membukanya di workbench, deskripsi menyusul, dan baris meta menyebutkan di papan mana ia berada, versinya dan kapan terakhir diperbarui. Pencarian mencocokkan nama dan deskripsi. Menu kartu membukanya, mengganti namanya, memindahkannya ke papan lain, menggandakannya atau, di bawah pemisah, menghapusnya. Menghapus bertanya lebih dulu dan membawa serta versinya; hapus atau pindah berlaku seketika dan snackbar mengatakannya dengan Undo, satu-satunya jalan kembali, dan laporan yang dihapus dibersihkan satu jam kemudian. Di papannya, laporan adalah tile bertanda Laporan dengan versinya, dalam nada utama, dan Open report memimpin menunya; tile yang disematkan bertanda Wawasan. Menghapus tile laporan dari papannya adalah penghapusan laporan itu, dengan Undo yang sama. Di bawah kartu workbench, strip versi menyebutkan versi saat ini, siapa yang menyimpannya dan kapan; Show history membentangkan setiap versi, apa yang berubah, oleh siapa dan kapan, tiga entri terlihat, dengan Restore di samping setiap entri kecuali yang saat ini, dan pemulihan menulis versi baru yang menyalin versi yang dipilih alih-alih menulis ulang riwayat.
A board and its tiles
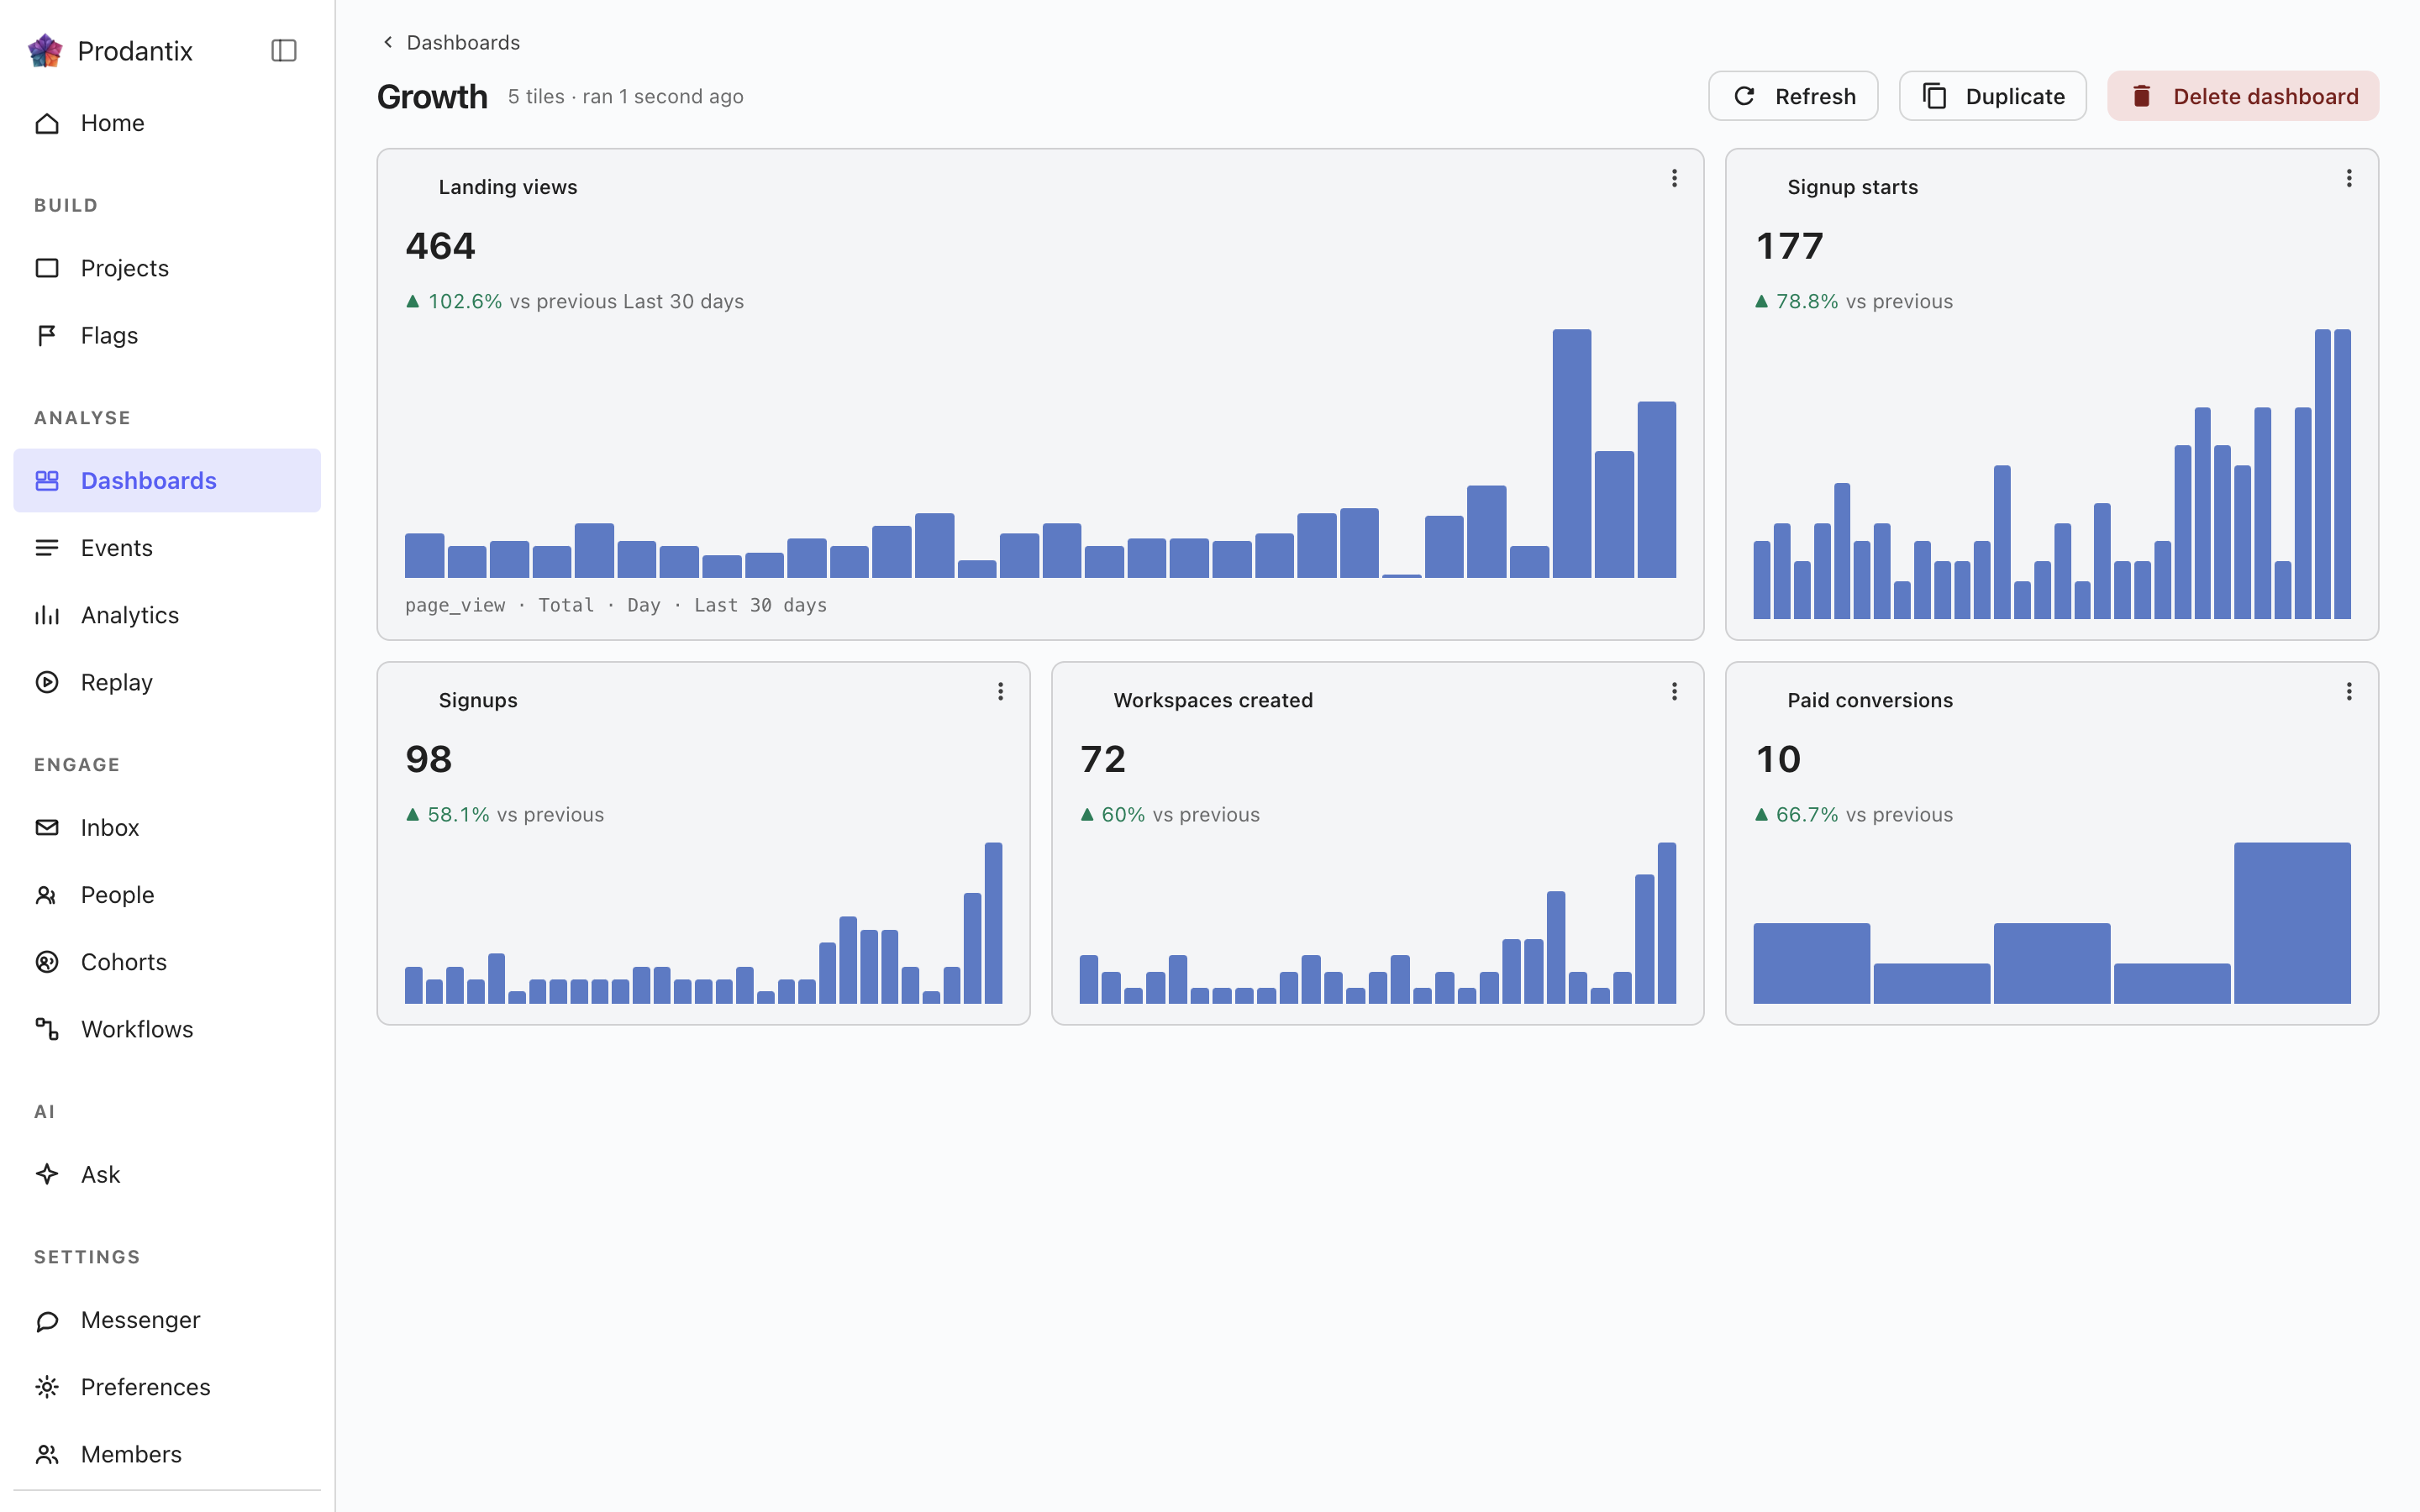
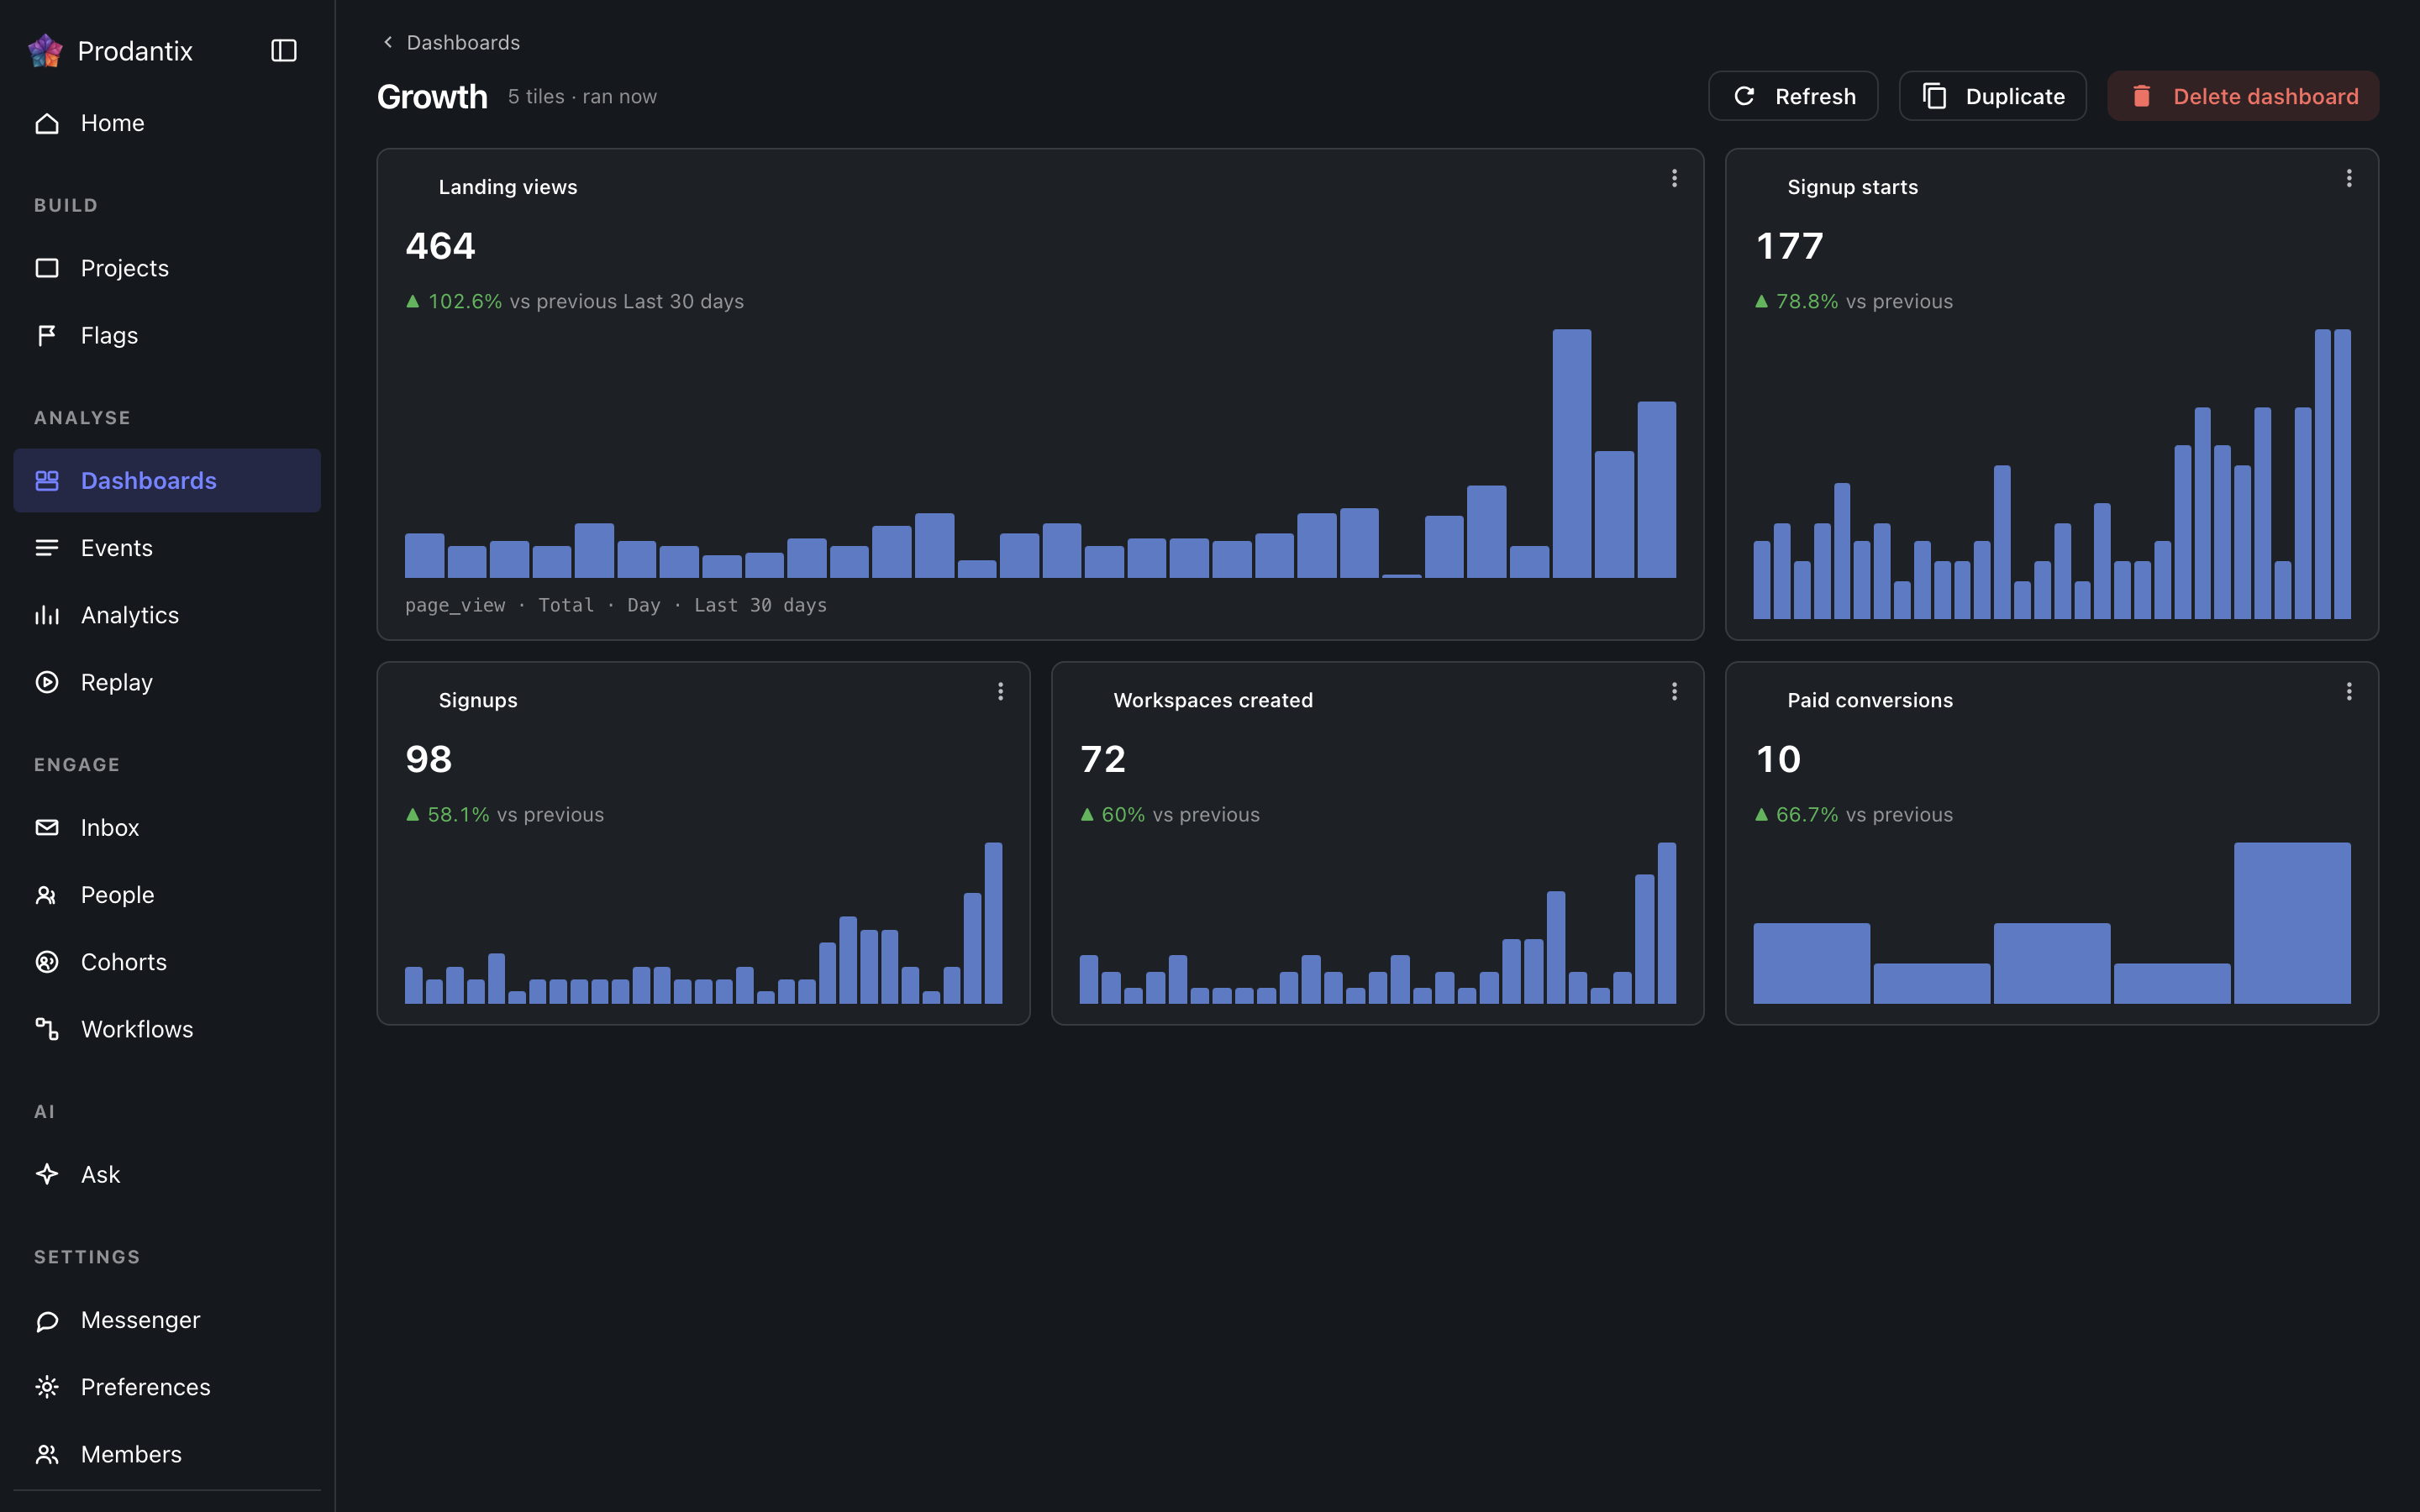
Each tile is one saved question: its title, the current total, a signed delta against the preceding window and a sparkline of the series. Tiles are added by asking a question in the Analytics workbench and pinning the result here; the pin dialog offers every existing board and a new one. A trend tile carries the whole query forward: every metric, any formula, its breakdowns and its compared period, so a re-run always answers exactly what was pinned. A tile that fails to load says so on the tile, with its own retry, rather than poisoning the board; Refresh re-runs every tile at once, and a tile's menu renames it, switches it between standard and wide widths, moves it along the grid, or removes it.
Insights
Wawasan adalah pertanyaan yang disimpan utuh: editor sebagaimana disusun, jenis analisisnya dan jenis grafik tempat ia dibaca, di bawah sebuah nama. Ia disimpan dari menu Save di workbench, As an insight, dan dibuka kembali dari sini atau dari alamat yang dibawa workbench sebagai ?insight=, dengan editor dan grafik dipulihkan. Kartu menamai jenis analisis pada sebuah chip, menuliskan pertanyaan dalam kata-kata beserta jenis grafiknya, dan menyebutkan kapan terakhir disimpan. Menunya membukanya, mengganti namanya, menyematkannya ke papan sebagai tile yang dinamai menurutnya, atau menghapusnya. Menghapus bertanya lebih dulu, dan papan yang memuatnya sebagai tile tetap menyimpan tile-nya, karena tile adalah salinan query-nya sendiri. Pencarian mencocokkan nama dan kata-katanya. Wawasan dengan pantauan membawa chip Dipantau setelah namanya, dalam nada peringatan selama ambangnya dilewati.
Salin ke… pada baris membuka penyalinan konfigurasi dengan objek ini sudah tercentang; lihat Proyek, Menyalin konfigurasi.
Where this meets the API
The concept behind the three tabs is the Analytics pillar. On the wire: the Boards tab is the dashboards query, the Reports tab is reports and the Insights tab is insights; boards change through createDashboard, updateDashboard and deleteDashboard (pinning a tile is an updateDashboard carrying the new tile), insights through createInsight, updateInsight and deleteInsight. A report is saved through createReport, read alone through report, changed through updateReport, renameReport, describeReport and moveReport, copied through duplicateReport, deleted through deleteReport and brought back through restoreReport; its history is reportVersions and Restore is restoreReportVersion, which writes a new version copying the chosen one. A report's public link is read through reportPublicLink, turned on or given a new stop day through setReportPublicLink and turned off through turnOffReportPublicLink, and reportShareChanges streams each change; shareReport sends it to teammates, with a note, by email and push. People talk about a report in threads, on the whole report or on one point of it: reportCommentThreads reads them, each with its first comment and latest two replies, reportCommentEarlierReplies reads the replies before those twenty at a time, startReportCommentThread starts one, replyToReportCommentThread answers it, resolveReportCommentThread and reopenReportCommentThread close and open it again, an author changes their own words through editReportComment and deleteReportComment, reactions come and go through addReportCommentReaction and removeReportCommentReaction, and reportCommentChanges streams each change. A report's tile carries only its reportId, and the board read fills the tile from the report, so every tile renders by running its query through runQuery (GraphQL reference). A run that names its report through reportId refreshes that report's public link when the query it ran is the one saved.