الرئيسية
الصفحة الأولى للوحة التحكم، في ثلاثة تبويبات. يقرأ Overview كم يصل من البيانات، وما الذي تحرك، وما الذي يحتاج إلى إنسان، كل رقم للأيام الأربعة عشر الأخيرة مقابل الأربعة عشر التي سبقتها. يحمل Reviews تغييرات الأعلام التي تنتظر عينين ثانيتين. يجمع Needs you تشغيلات سير العمل الفاشلة والمنتظرة إلى جانب الأعلام التي تحتاج إلى انتباه، بطاقة لكل منها، ويعدّ مدخل Home في الشريط الجانبي ما يحمله هذان التبويبان.
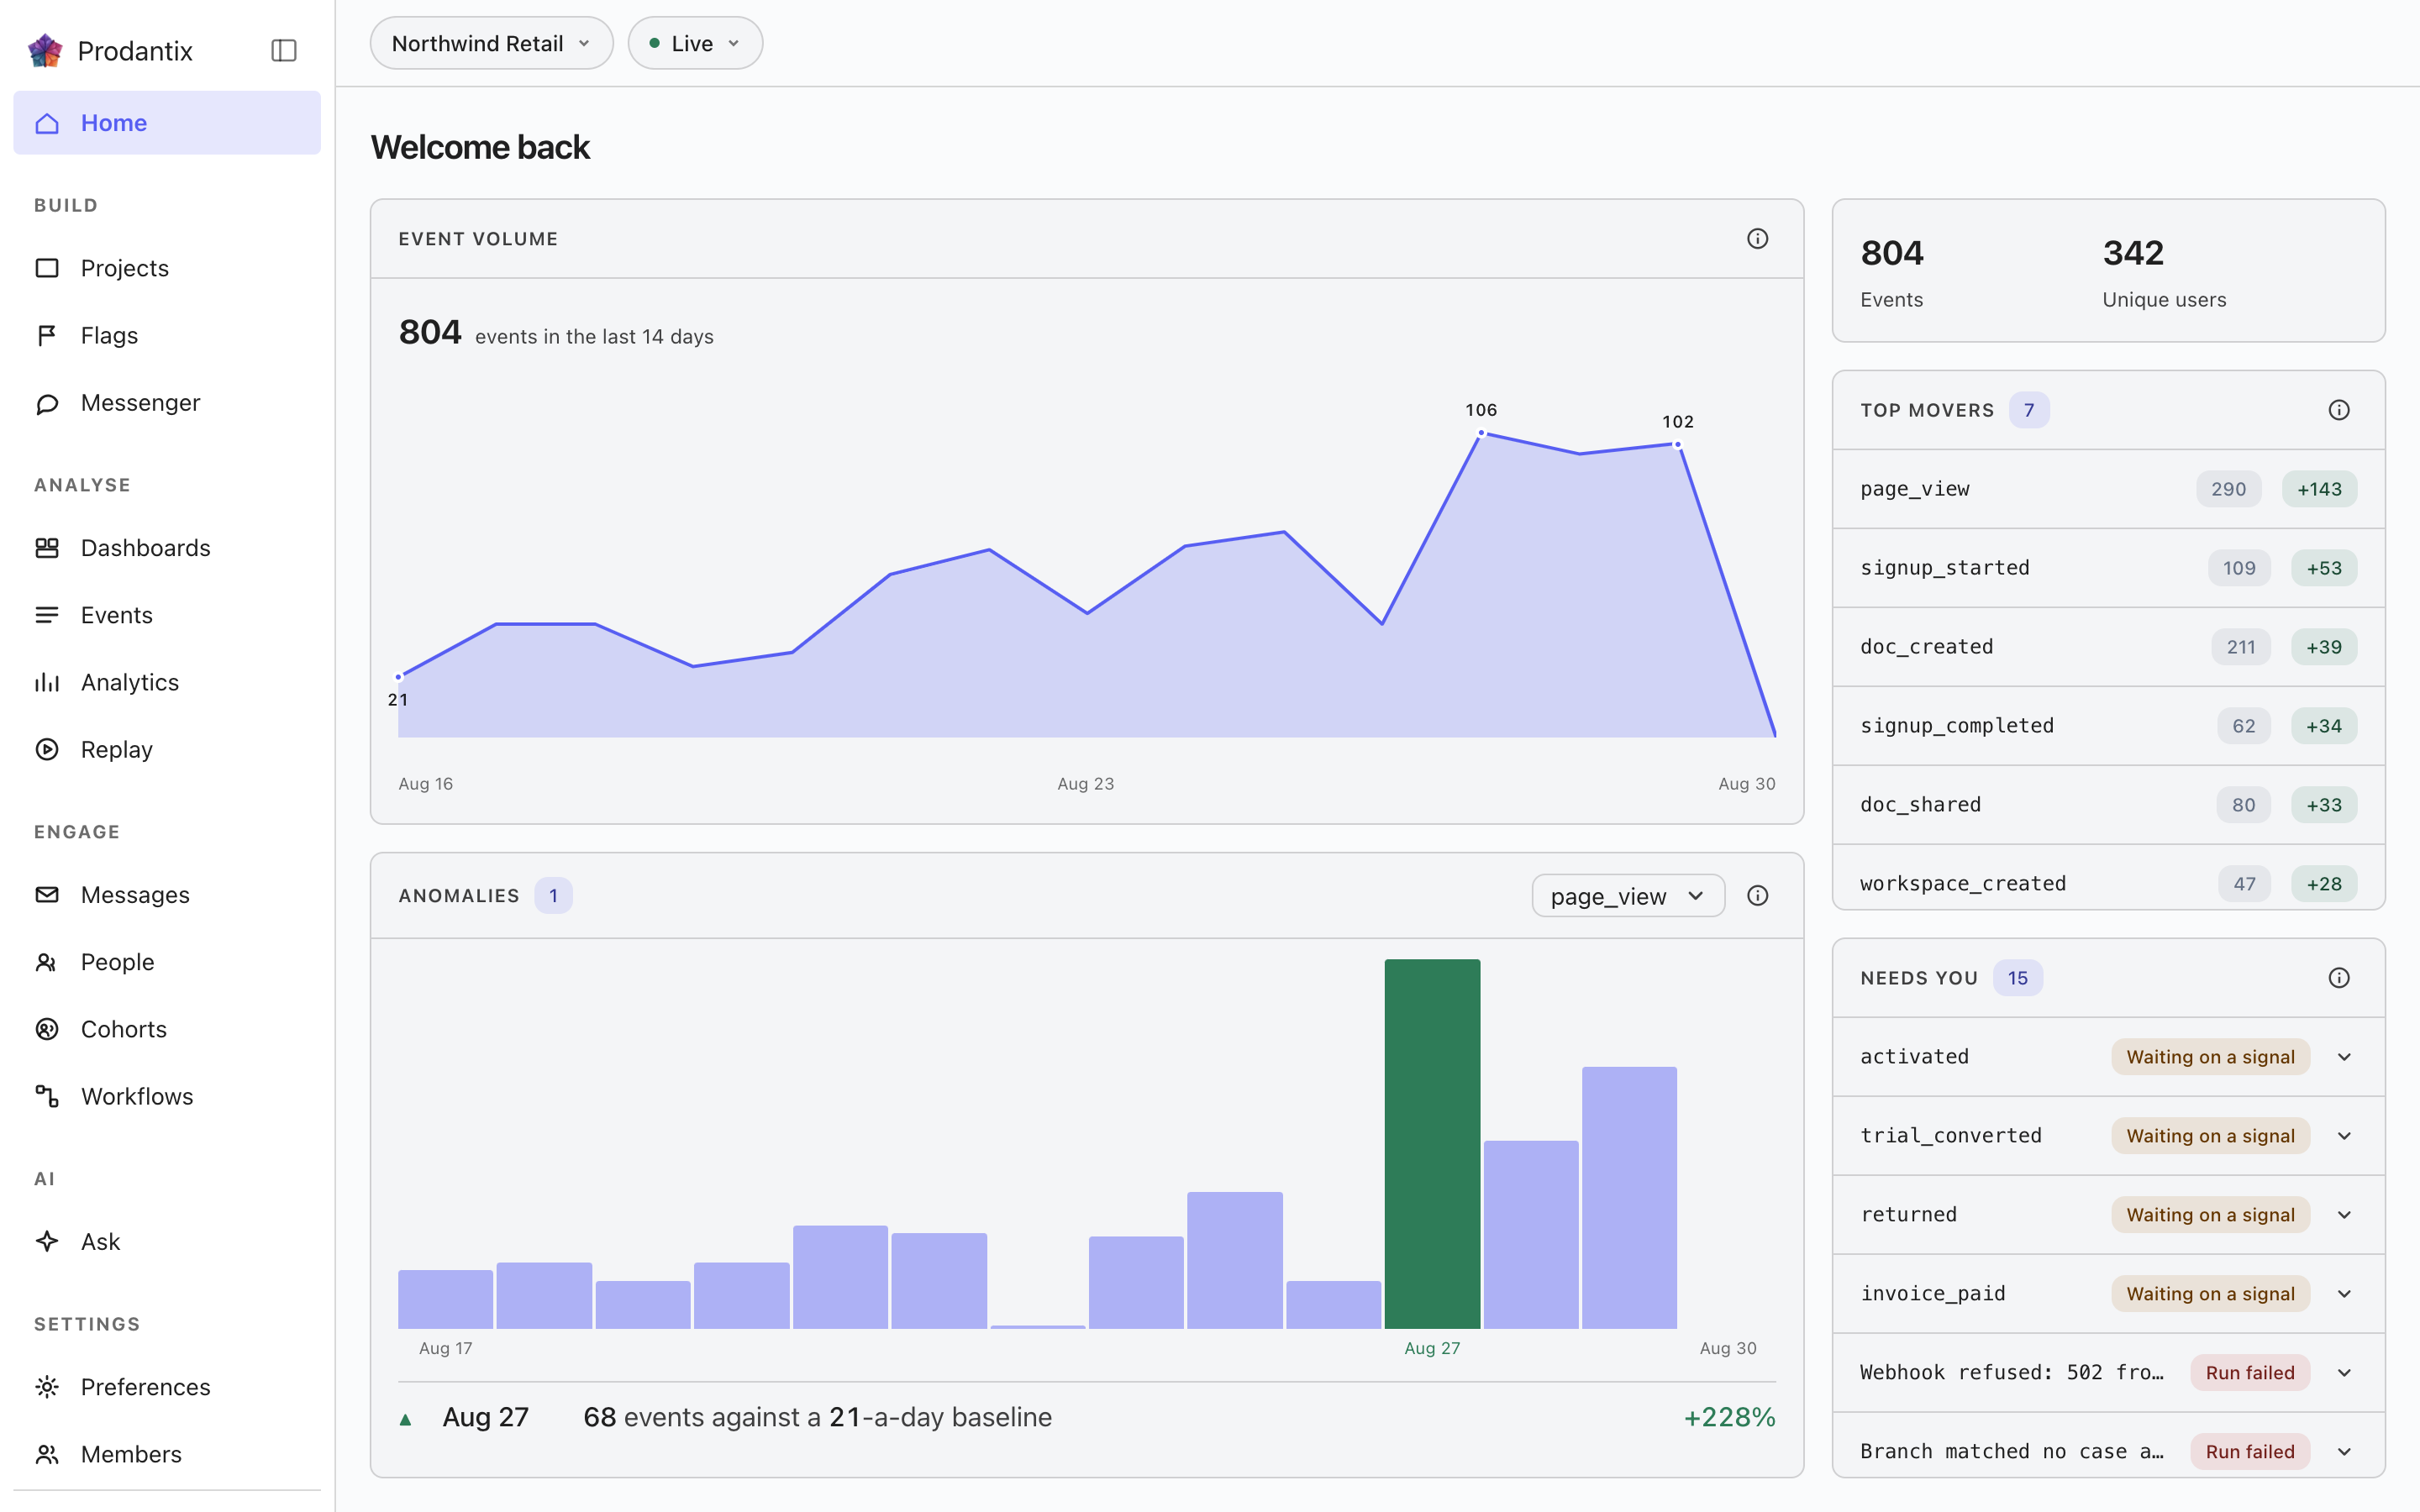
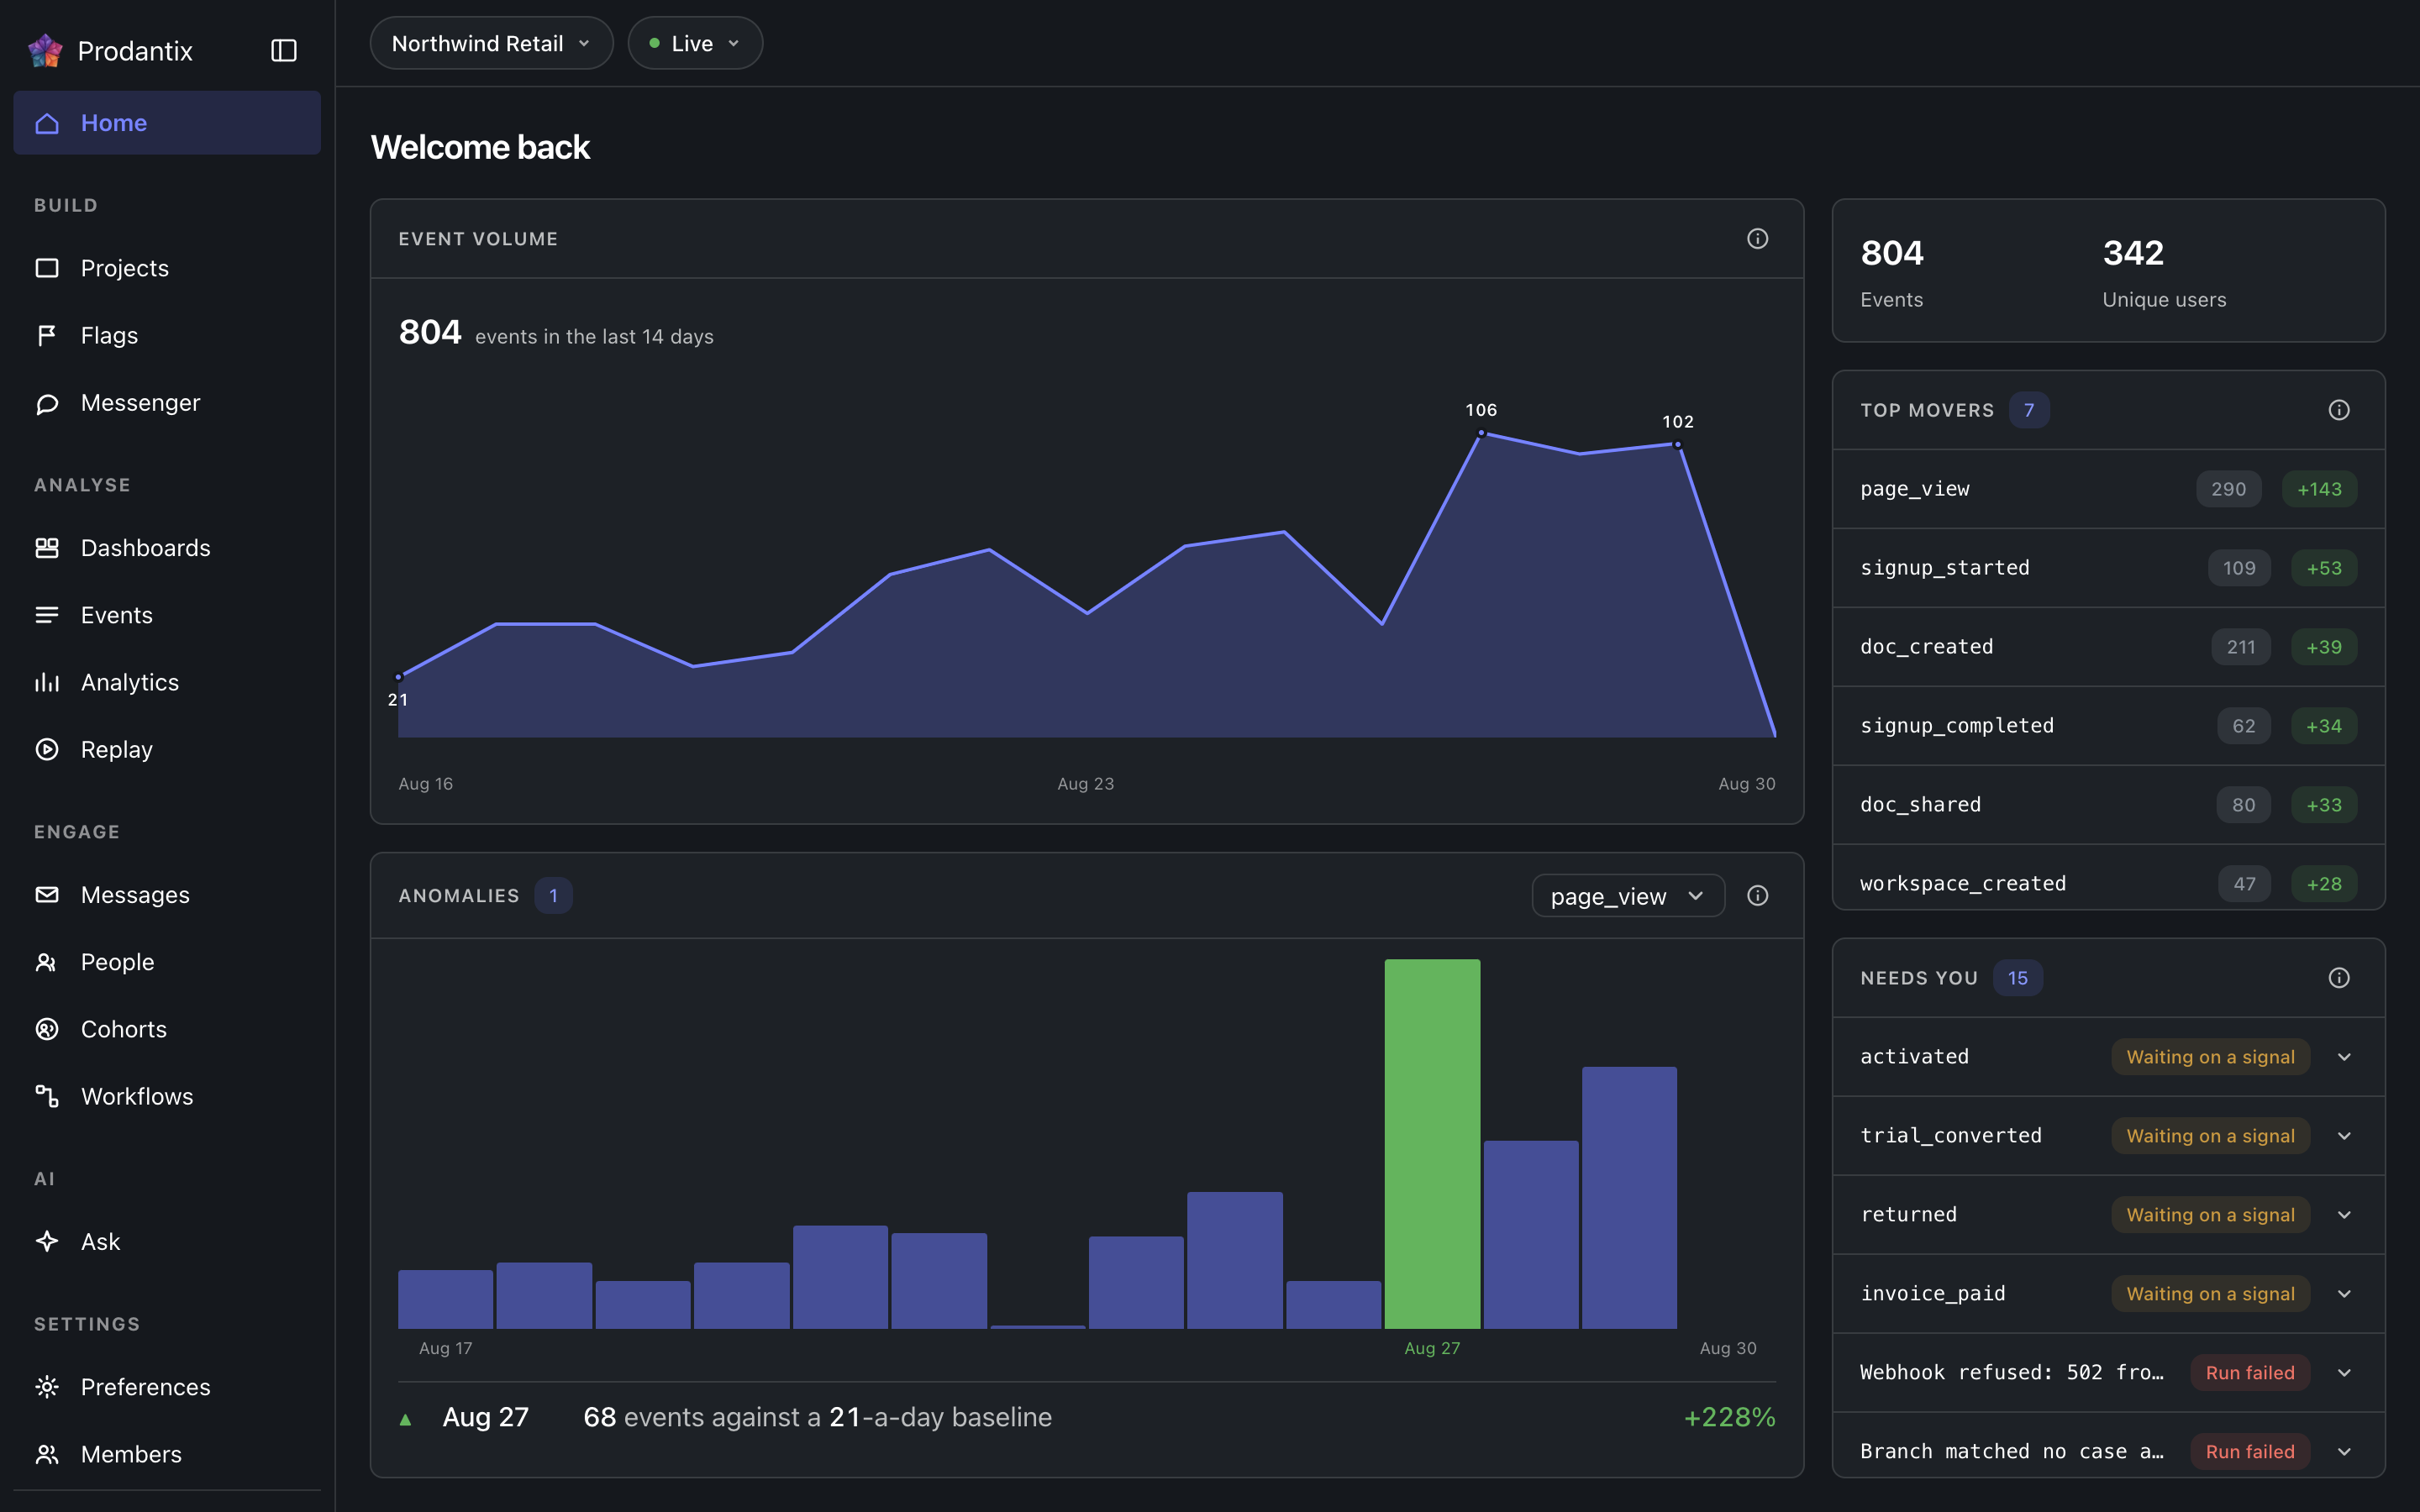
Three tabs
Overview هو الصفحة الأولى اليوم: شريط المقاييس، وTop movers، وEvent volume، وAnomalies. Reviews هو صندوق المراجعة الذي كان صفحة مستقلة: طلبات تغيير الأعلام في المشروع، مصفاة بالحالة وقابلة للبحث، يفتح كل منها طلبه إلى جانب الشبكة، والعنوان القديم، /reviews، يحوّل إلى هنا. يسرد Needs you كل ما على الإنسان معالجته، بطاقة لكل عنصر. يحمل صف التبويبات عداداً على Reviews وعلى Needs you، ويحمل مدخل Home في الشريط الجانبي مجموعهما، فيقول القضيب كم ينتظر قبل فتح الصفحة. يحمل العنوان التبويب بصيغة ?tab=، فيهبط الرابط على التبويب الذي يسميه.
The metrics band
Two totals for the last fourteen days: events received and the people they came from. A project with nothing in the window shows an explanation rather than zeros, and a failed load says it failed rather than reading as a quiet account.
Needs you
كل ما على الإنسان معالجته، بطاقة لكل منها: تشغيلات سير العمل التي فشلت، والتشغيلات المنتظرة لإشارة، والأعلام التي لم يقيّمها شيء مؤخراً، والأعلام التي تجاوزت العمر الذي تعلنه نيتها. يرتدي التشغيل الفاشل نبرة الخطأ؛ أما الثلاثة الأخرى فنداءات إلى القارئ لا أعطال. تسمي كل بطاقة نوعها على شارة، ووقائعها في سطر واحد، وتحمل مخرجها الخاص: افتح التشغيل أو العلم الذي تسميه، أو أطلق سير العمل من جديد، أو أرسل الإشارة التي ينتظرها تشغيل منتظر، أو أرشف علماً انتهى. العدد على التبويب هو القائمة كاملة، فتظل قائمة تتمرر تقول كم تحمل. الرؤية المراقبة التي تجاوز حدها هي نوع خامس، الحد: تسمي البطاقة الرؤية والحد والقيمة التي قرأها الفحص اليومي، وتفتح الرؤية مع الشريط الذي تجاوزته.
Top movers
The events whose counts moved most against the preceding window of equal length: the last fourteen days against the fourteen before them. Each row shows the current count and a signed delta, so a spike and a collapse are equally visible.
Event volume
Ingest volume across the window as a chart, with empty days drawn as empty rather than skipped: a project that went quiet for a week looks quiet, not compressed.
Anomalies
One event at a time, chosen in the panel's picker and opening on the project's busiest: a bar per day across the fourteen-day window, so the baseline is visible rather than asserted. A day whose count left that baseline is tinted and dated, and a row beneath marks it ▲ or ▼ and names the count against the baseline it left. A fortnight that held its line still draws the band and says so.
The account menu


Your avatar at the foot of the sidebar opens the account menu. Under your name and email, the first group is your companies: every prodantix company this sign-in belongs to, the name over your role in it (Owner, Admin, Billing or Member), with a check on the one the console is scoped to. Choose another and the row shows a spinner while the console asks your sign-in to scope to that company, then reloads: the re-drawn console is the confirmation, and there is no toast. A switch that failed says so under the row, with Retry. When your sign-in is too old to switch with, the row reads Your sign-in is out of date and offers Sign in again, which signs you in afresh and brings you back to the page you were on. One company held still draws its row with the check, so you can see which company scopes everything the menu names below it. The group offers no create and no manage row: you join an existing company by invitation (User management), never from here. On the wire the group is myCompanies (GraphQL reference); a switch is a session call that carries your own sign-in, so it is not part of the GraphQL API.
A sign-in whose token names no prodantix company, which happens when the Bomdisoft ID joined another product's company first, does not land in an empty console. The page body is replaced by one card, Choose a company, with the sidebar staying in place around it. The card lists the same rows as the menu with every gutter empty, since nothing is active yet, and nothing is chosen on your behalf: a member of one company still sees one row and picks it. Choosing scopes the sign-in to that company and reloads the console. A card whose list could not be read draws Retry where the rows would be.
A sign-in that belongs to no prodantix company at all meets Set up your company in the same place, with the sidebar faded around it and a note in the sidebar saying that projects, analytics and messages live in a company. When you own an organisation in another Bomdisoft product, a switch offers Use one you own, which turns the organisation you pick into your prodantix company, or Create a new one. Using one brings only you in: nobody else in that organisation joins prodantix. With nothing to use, the card asks for a Company name straight away. Either way you name the company's first project under First project name and press Create once; the console shows that project's keys, and Continue opens Home in the new company. When your organisations could not be checked, the switch stays with Use one you own unavailable and Create a new one selected, over the line Could not check for organisations you already own. and a Try again. A company that was made but is not ready yet says so and finishes on the next Create, and an organisation that already has a prodantix company asks you to get an invitation from its owner. Joining somebody else's company is still by invitation, and the card says so under Create.
Below the divider, the accounts group: the prodantix accounts this sign-in holds, each by its name, or numbered and marked unnamed when it has none, with the current one checked. Picking another switches the same way, a spinner on the row and the console reloading on that account, with the reason inline and Retry if it failed. A suspended account carries a Suspended chip and cannot be opened.
The rows after the groups leave the console: Manage account opens your Bomdisoft account in a new tab, where profile, security and devices live for every Bomdisoft product; Billing opens the shared billing site the same way; Sign out ends the session.
Where this meets the API
The concept behind the numbers is the Analytics pillar. On the wire, every panel is a read: the metrics band, movers and volume are runQuery aggregations, the anomalies strip pairs runQuery with aiInsights (a z-score over the same daily counts, no model call), Needs you joins flags with workflow runs, and the Reviews tab reads flagChangeRequests, answered through approveFlagChange and rejectFlagChange, or taken back by the requester through withdrawFlagChange (GraphQL reference). The events being counted arrive through the ingest edge (Ingestion), and Needs you stays current between reloads by listening to flag and workflow run changes (Realtime events).